
Analysis
Three side panels sit next to the grid: Statistics, Chart and SQL. Open them from the toolbar, from the Command Palette, or from a column’s header menu.
Column statistics
Section titled “Column statistics”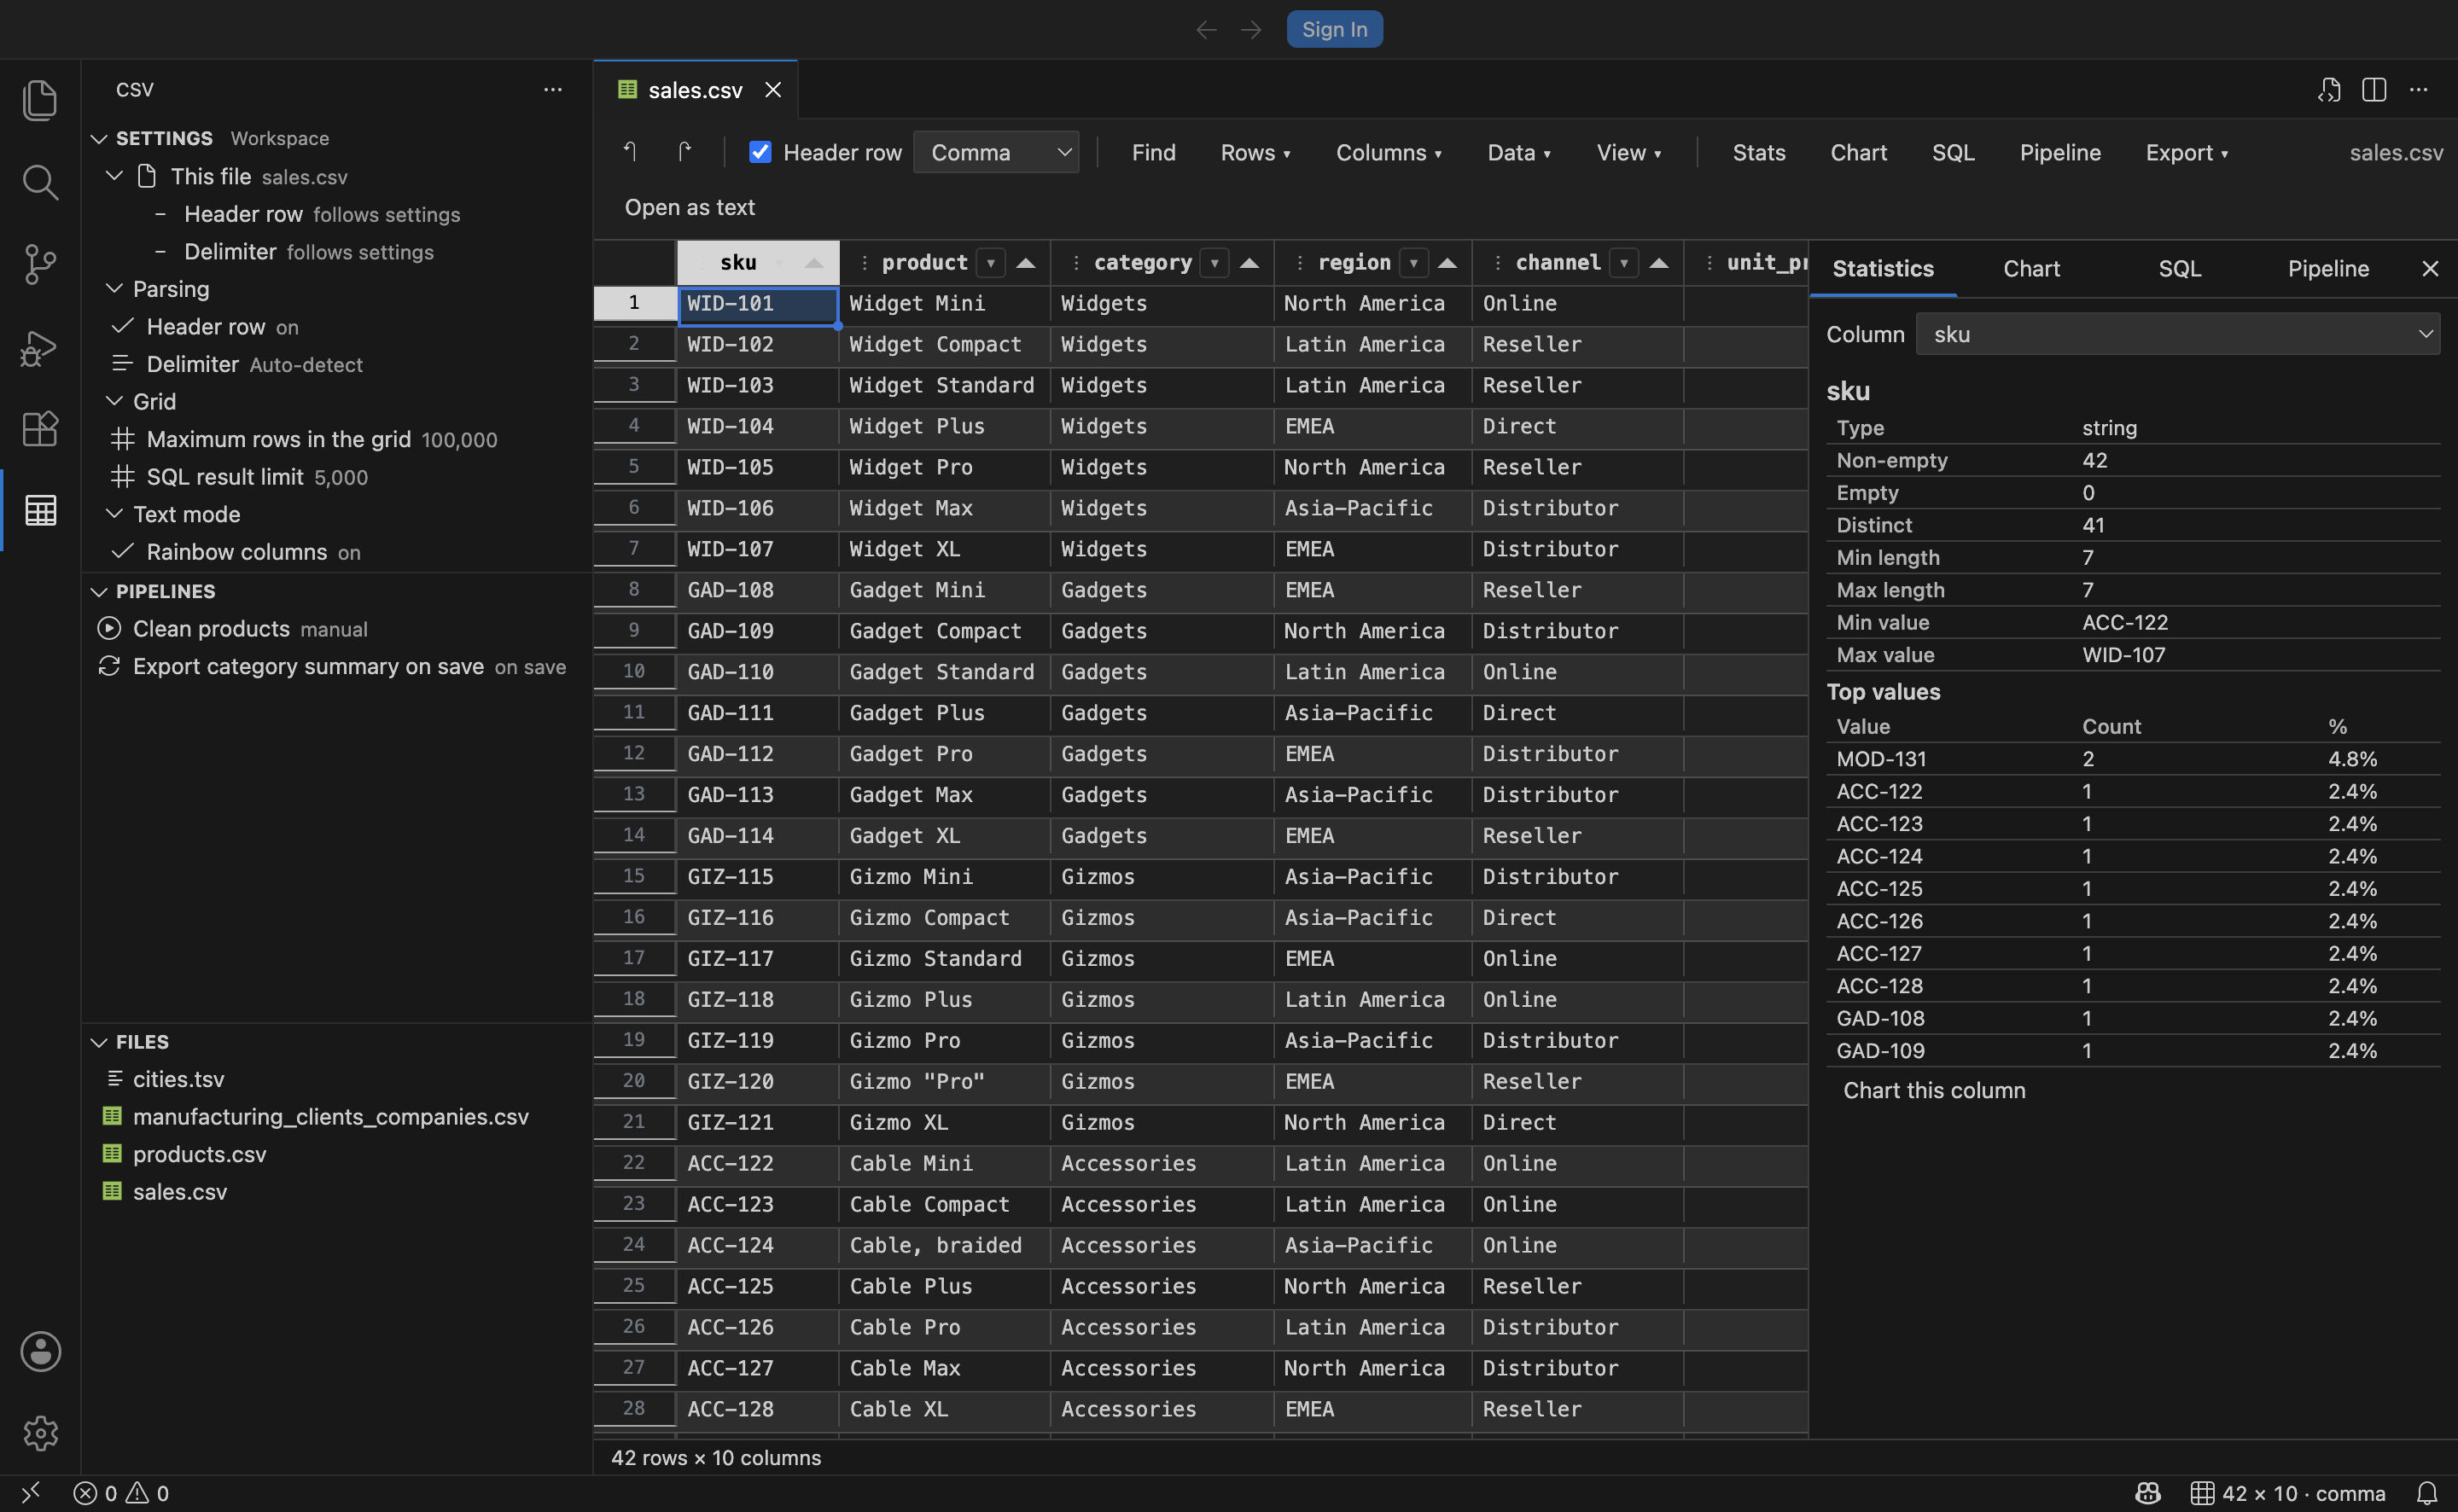
Pick any column to see:
| Always | For numeric columns | For other columns |
|---|---|---|
| Inferred type | Sum, mean, median | Lexical minimum and maximum |
| Non-empty and empty counts | Standard deviation | |
| Distinct value count | Minimum, Q1, Q3, maximum | |
| Minimum and maximum text length |
Below that is a frequency table of the ten most common values with their counts and percentages, which is usually the fastest way to spot inconsistent categories, stray whitespace or an unexpected null marker.
On a file larger than csv.maxRows, statistics cover the loaded rows and the panel says so.
Charts
Section titled “Charts”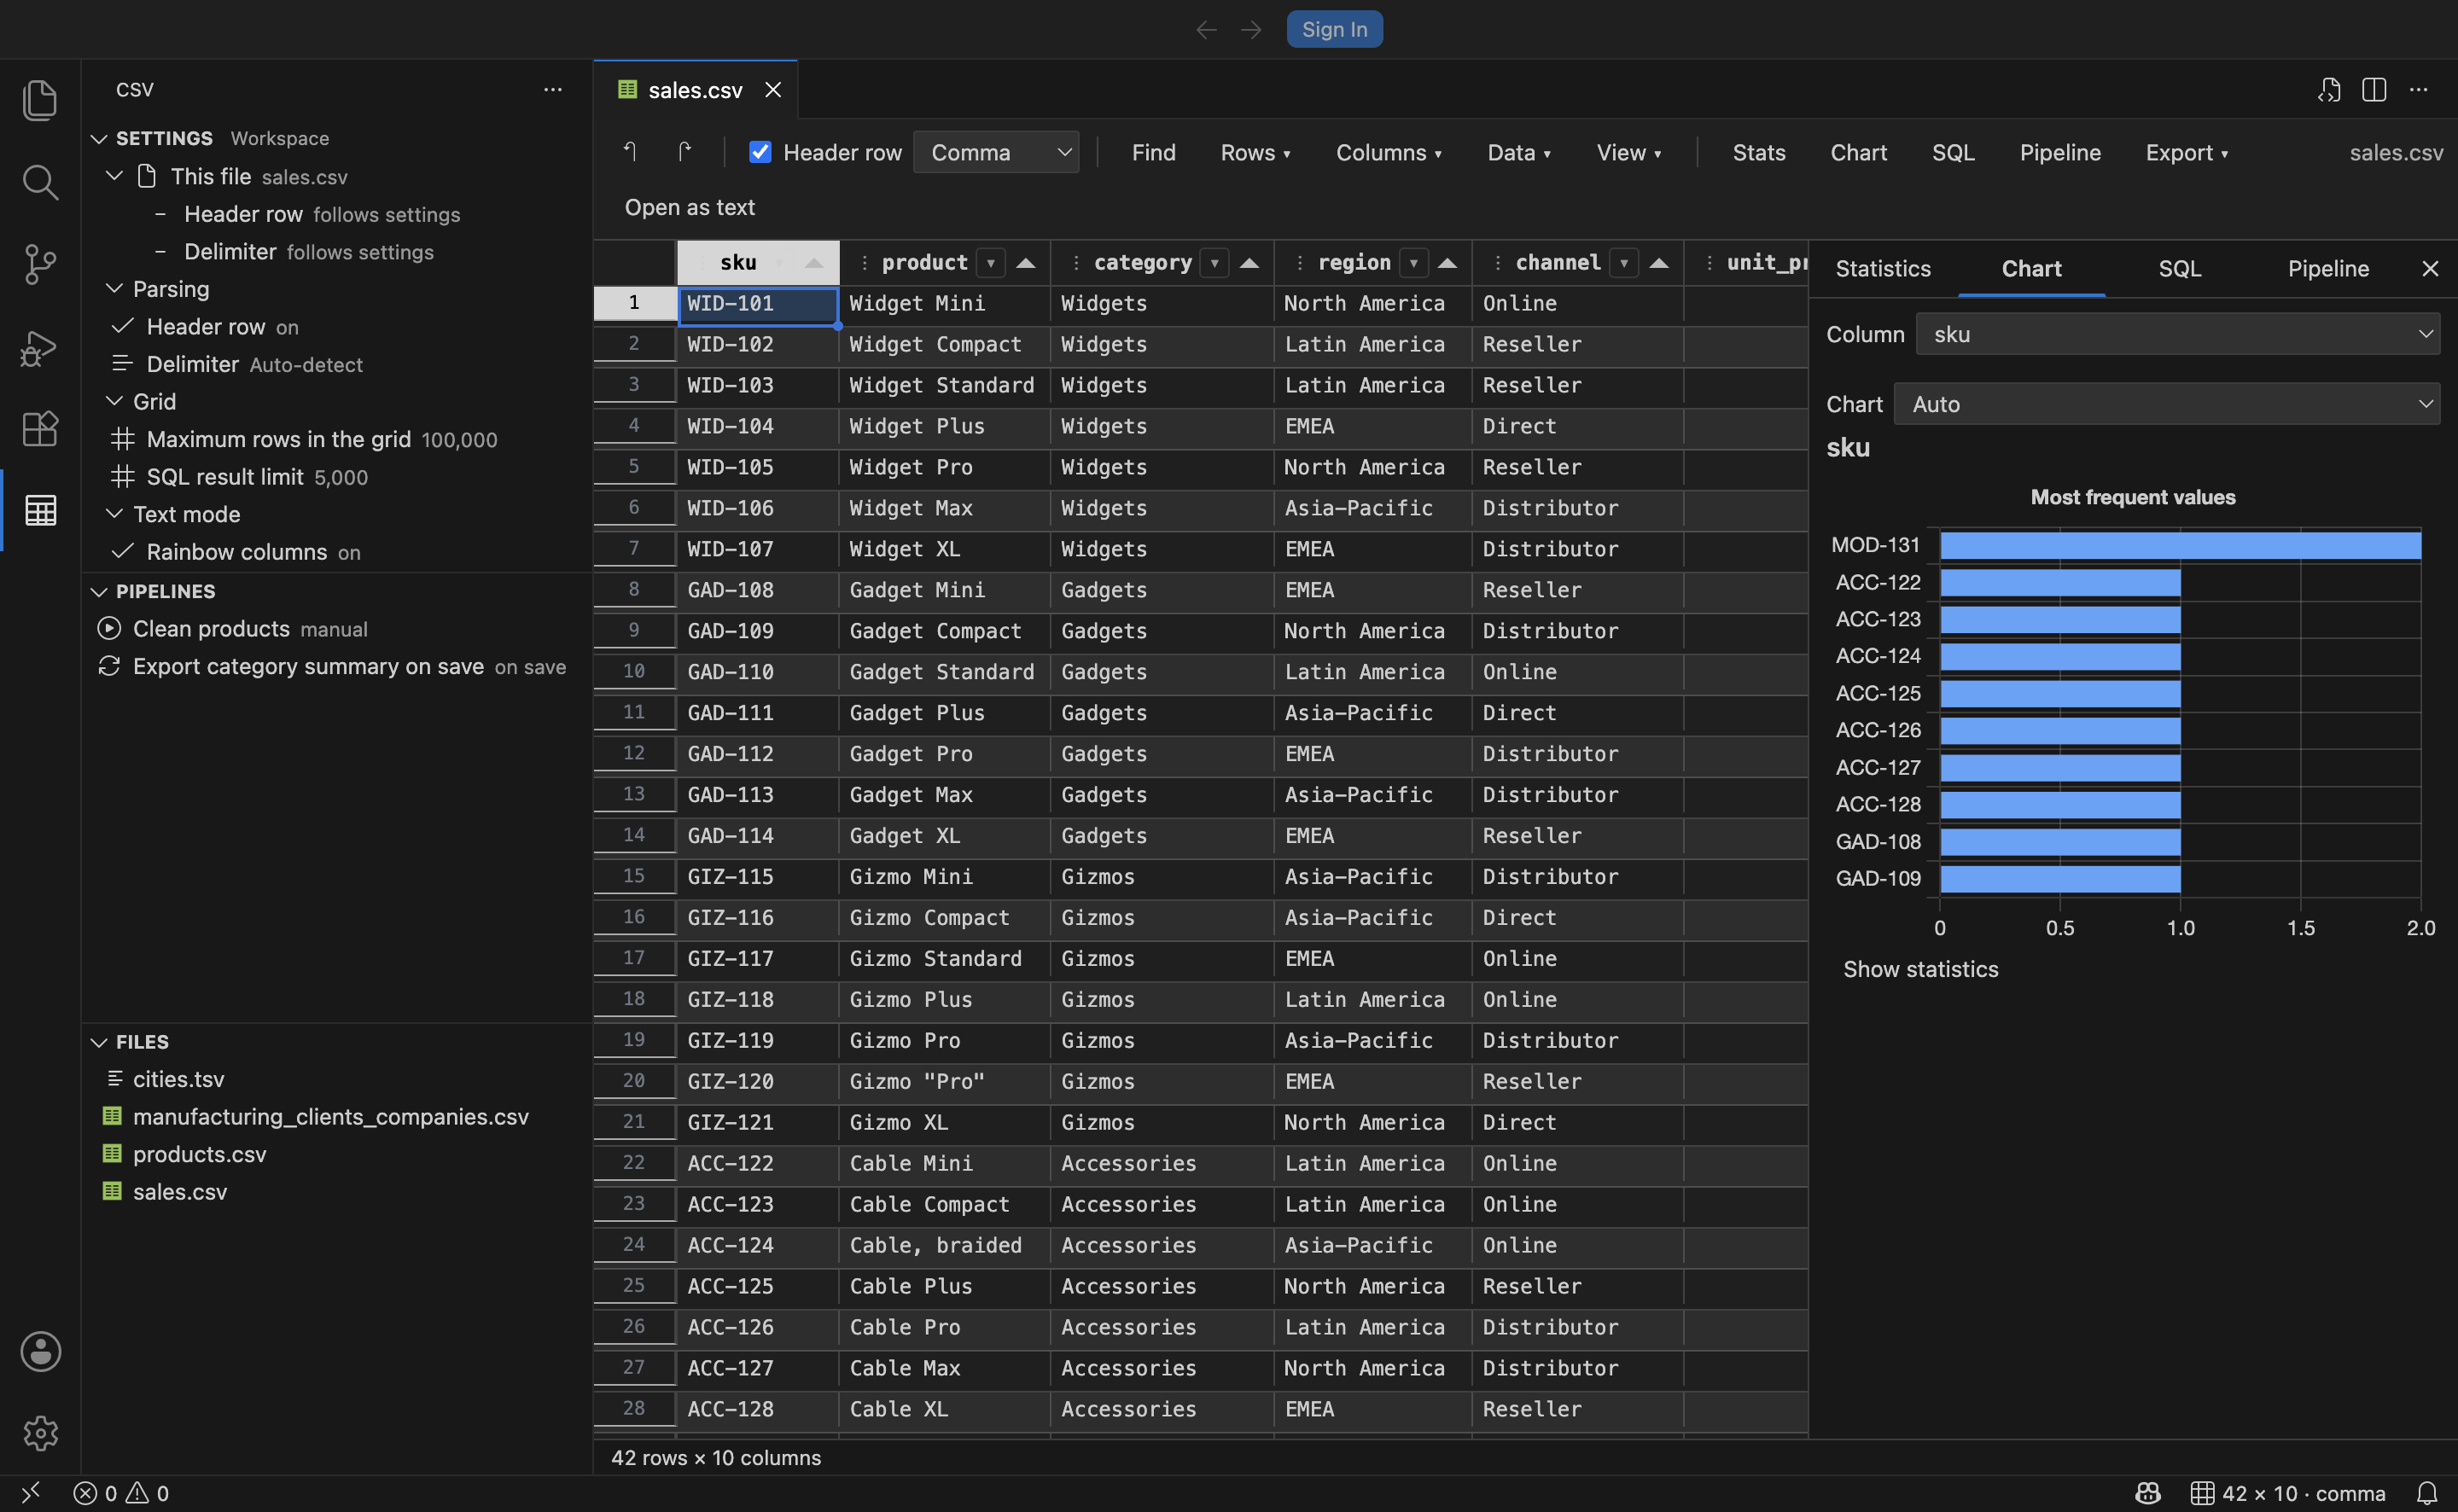
The Chart panel draws one of two things, chosen automatically or forced from the dropdown:
- Histogram for numeric columns, dividing the range into twelve buckets. Bucket labels use a precision derived from the bucket width.
- Top values bar chart for everything else, showing the most frequent values.
Charts follow the active VS Code theme.
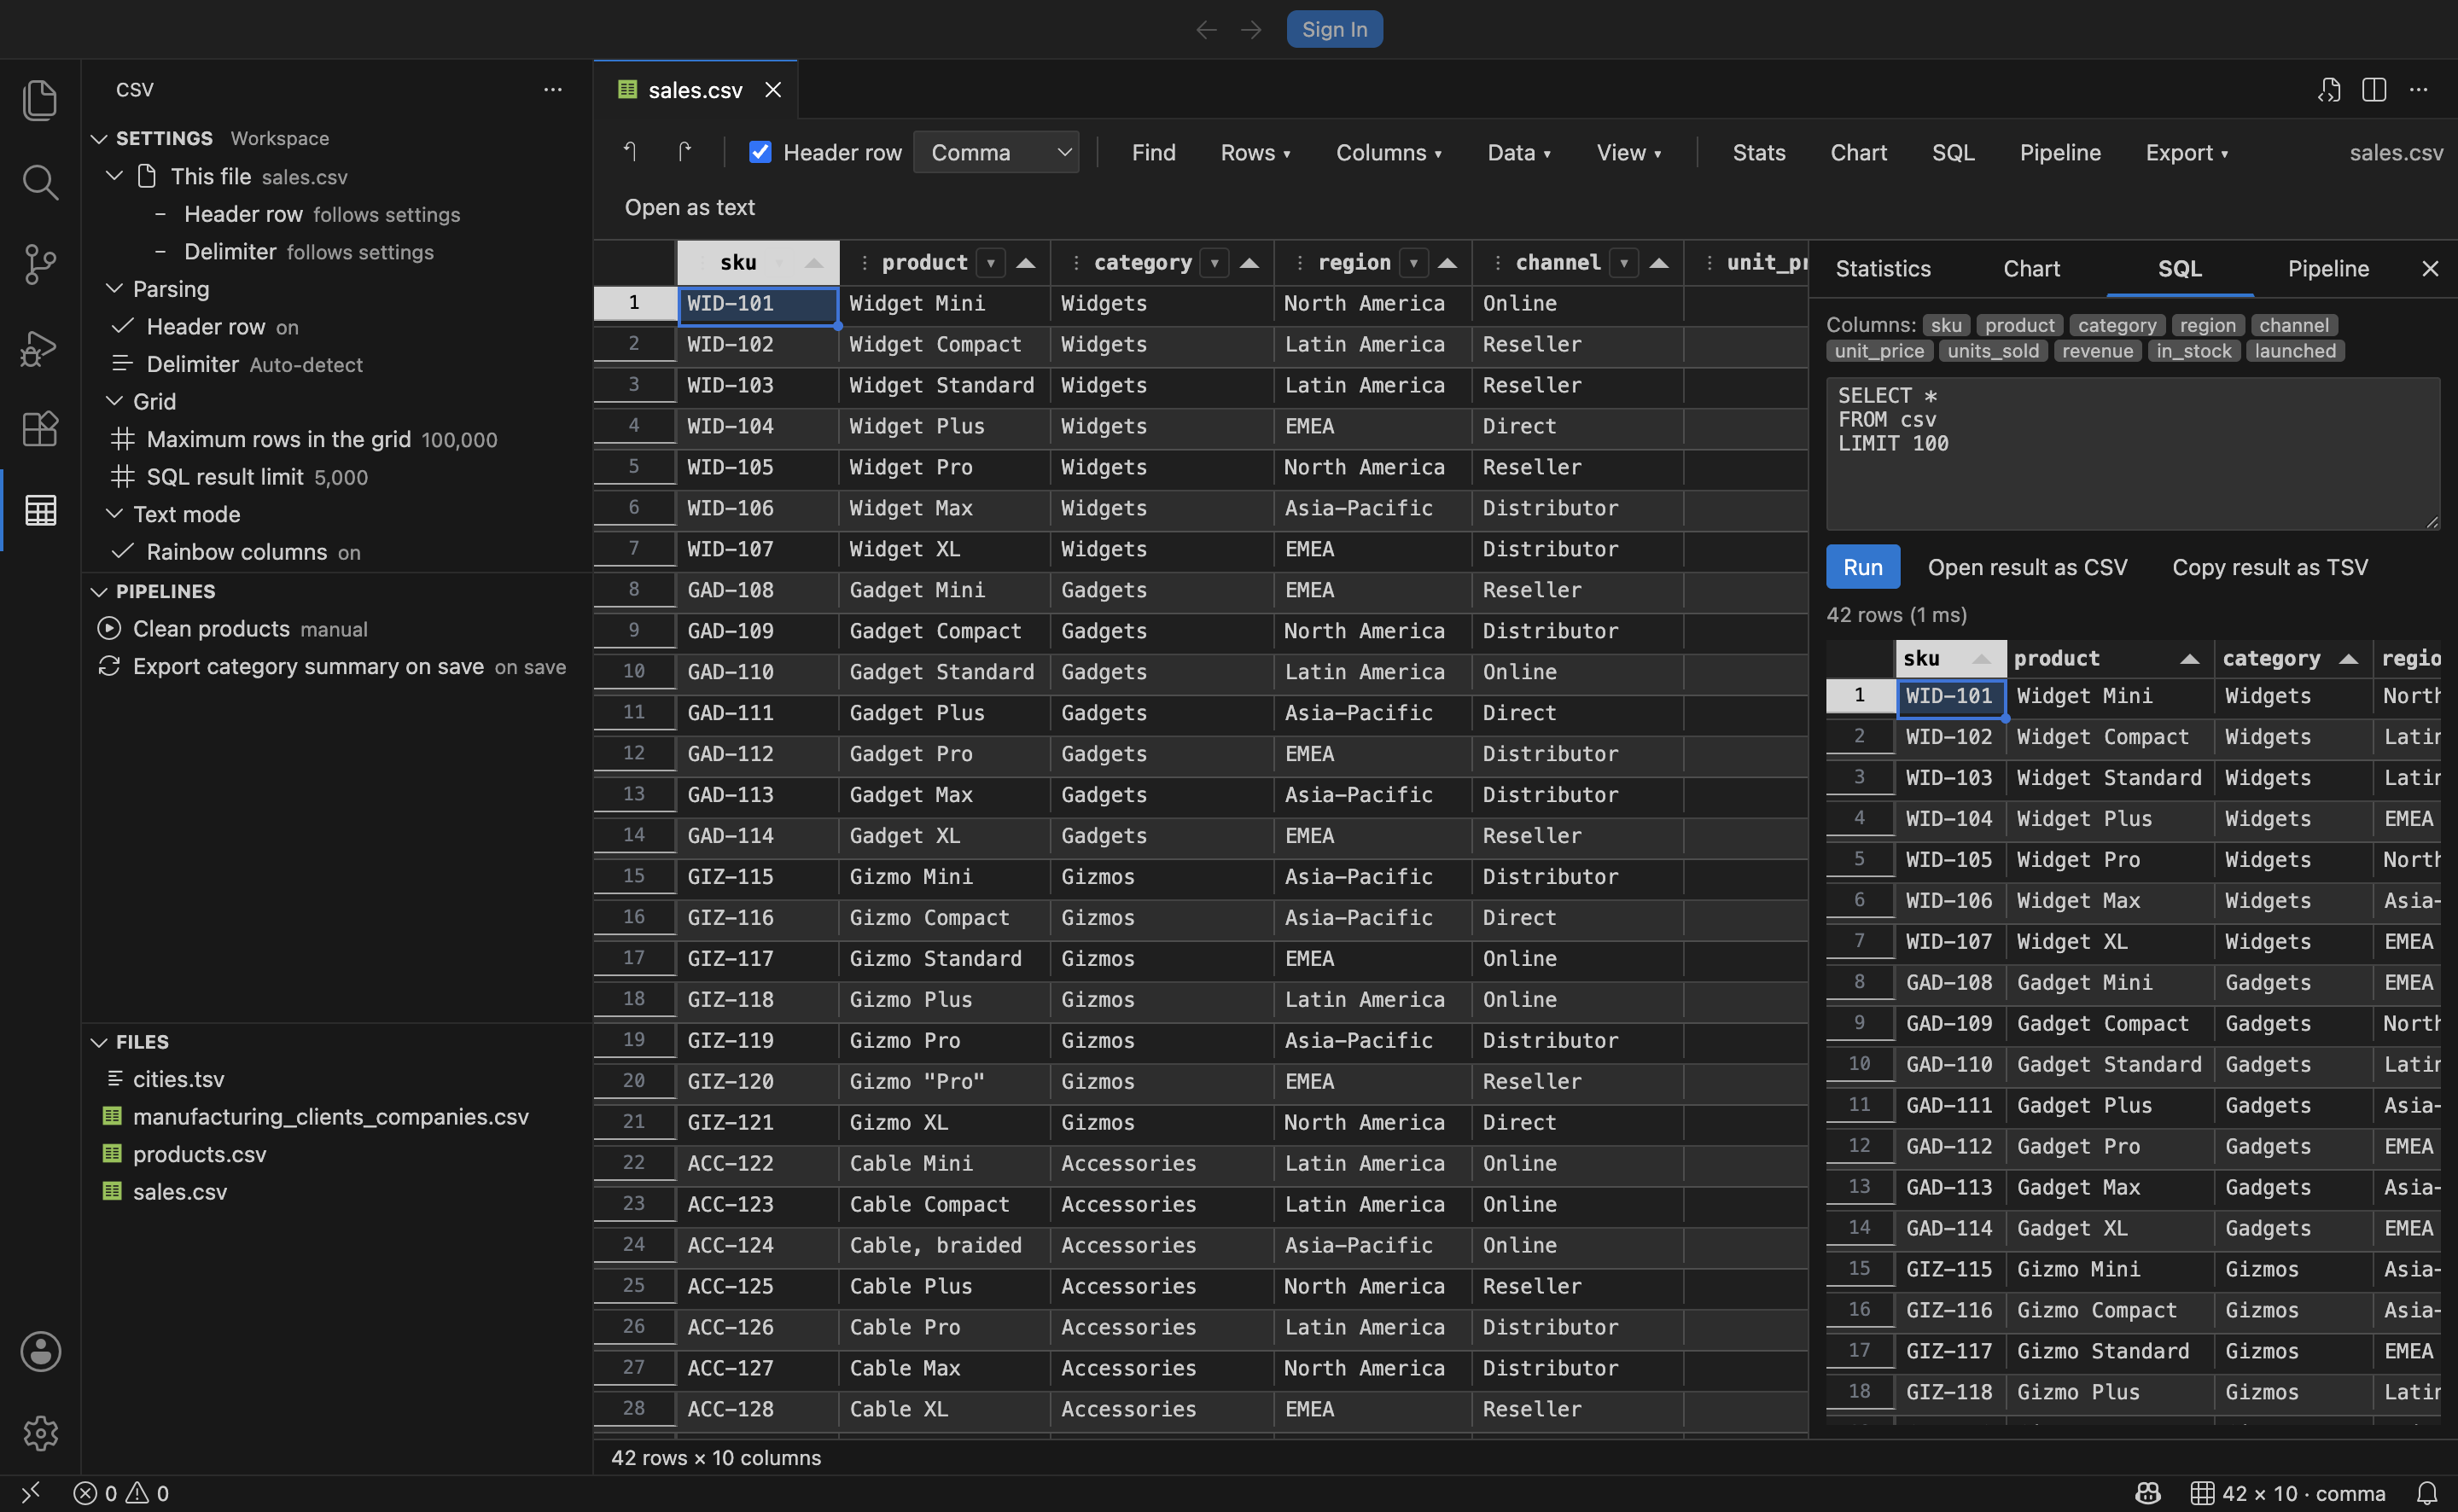
The SQL panel runs real SQLite queries over the file through sql.js, which is SQLite compiled to WebAssembly. The whole file is loaded into a table named csv, whatever csv.maxRows is set to.
SELECT category, COUNT(*) AS products, ROUND(SUM(revenue), 2) AS revenueFROM csvWHERE in_stock = 'true'GROUP BY categoryORDER BY revenue DESC- Column names become SQLite column names. Names with spaces or punctuation need double quotes:
SELECT "unit price" FROM csv. Click a column chip above the editor to insert a correctly quoted name. - Columns inferred as integer or number are stored as
INTEGERorREAL, so numeric comparisons and aggregates work without casting. Everything else isTEXT. Empty cells becomeNULL. Ctrl+Enterruns the query. The status line reports the row count and elapsed time.- Results are capped by
csv.sqlResultLimit, which defaults to 5,000 rows. The panel tells you when a result was truncated. - Open result as CSV turns the result set into a new CSV document. Copy result as TSV puts it on the clipboard, ready to paste into a spreadsheet.
The database is rebuilt whenever the document changes, so queries always see current data. Statements that modify the in-memory table, such as DELETE, do not touch your file, and the change is discarded on the next rebuild.
Anything beyond a single query, or anything you want to repeat, belongs in a pipeline, where a sql step can be one stage of a longer transformation.