
Feature tour
This is the whole extension in the order you would meet it. Every screenshot is the real thing; nothing here is a mock-up. Each section links to the guide that covers it properly.
The grid
Section titled “The grid”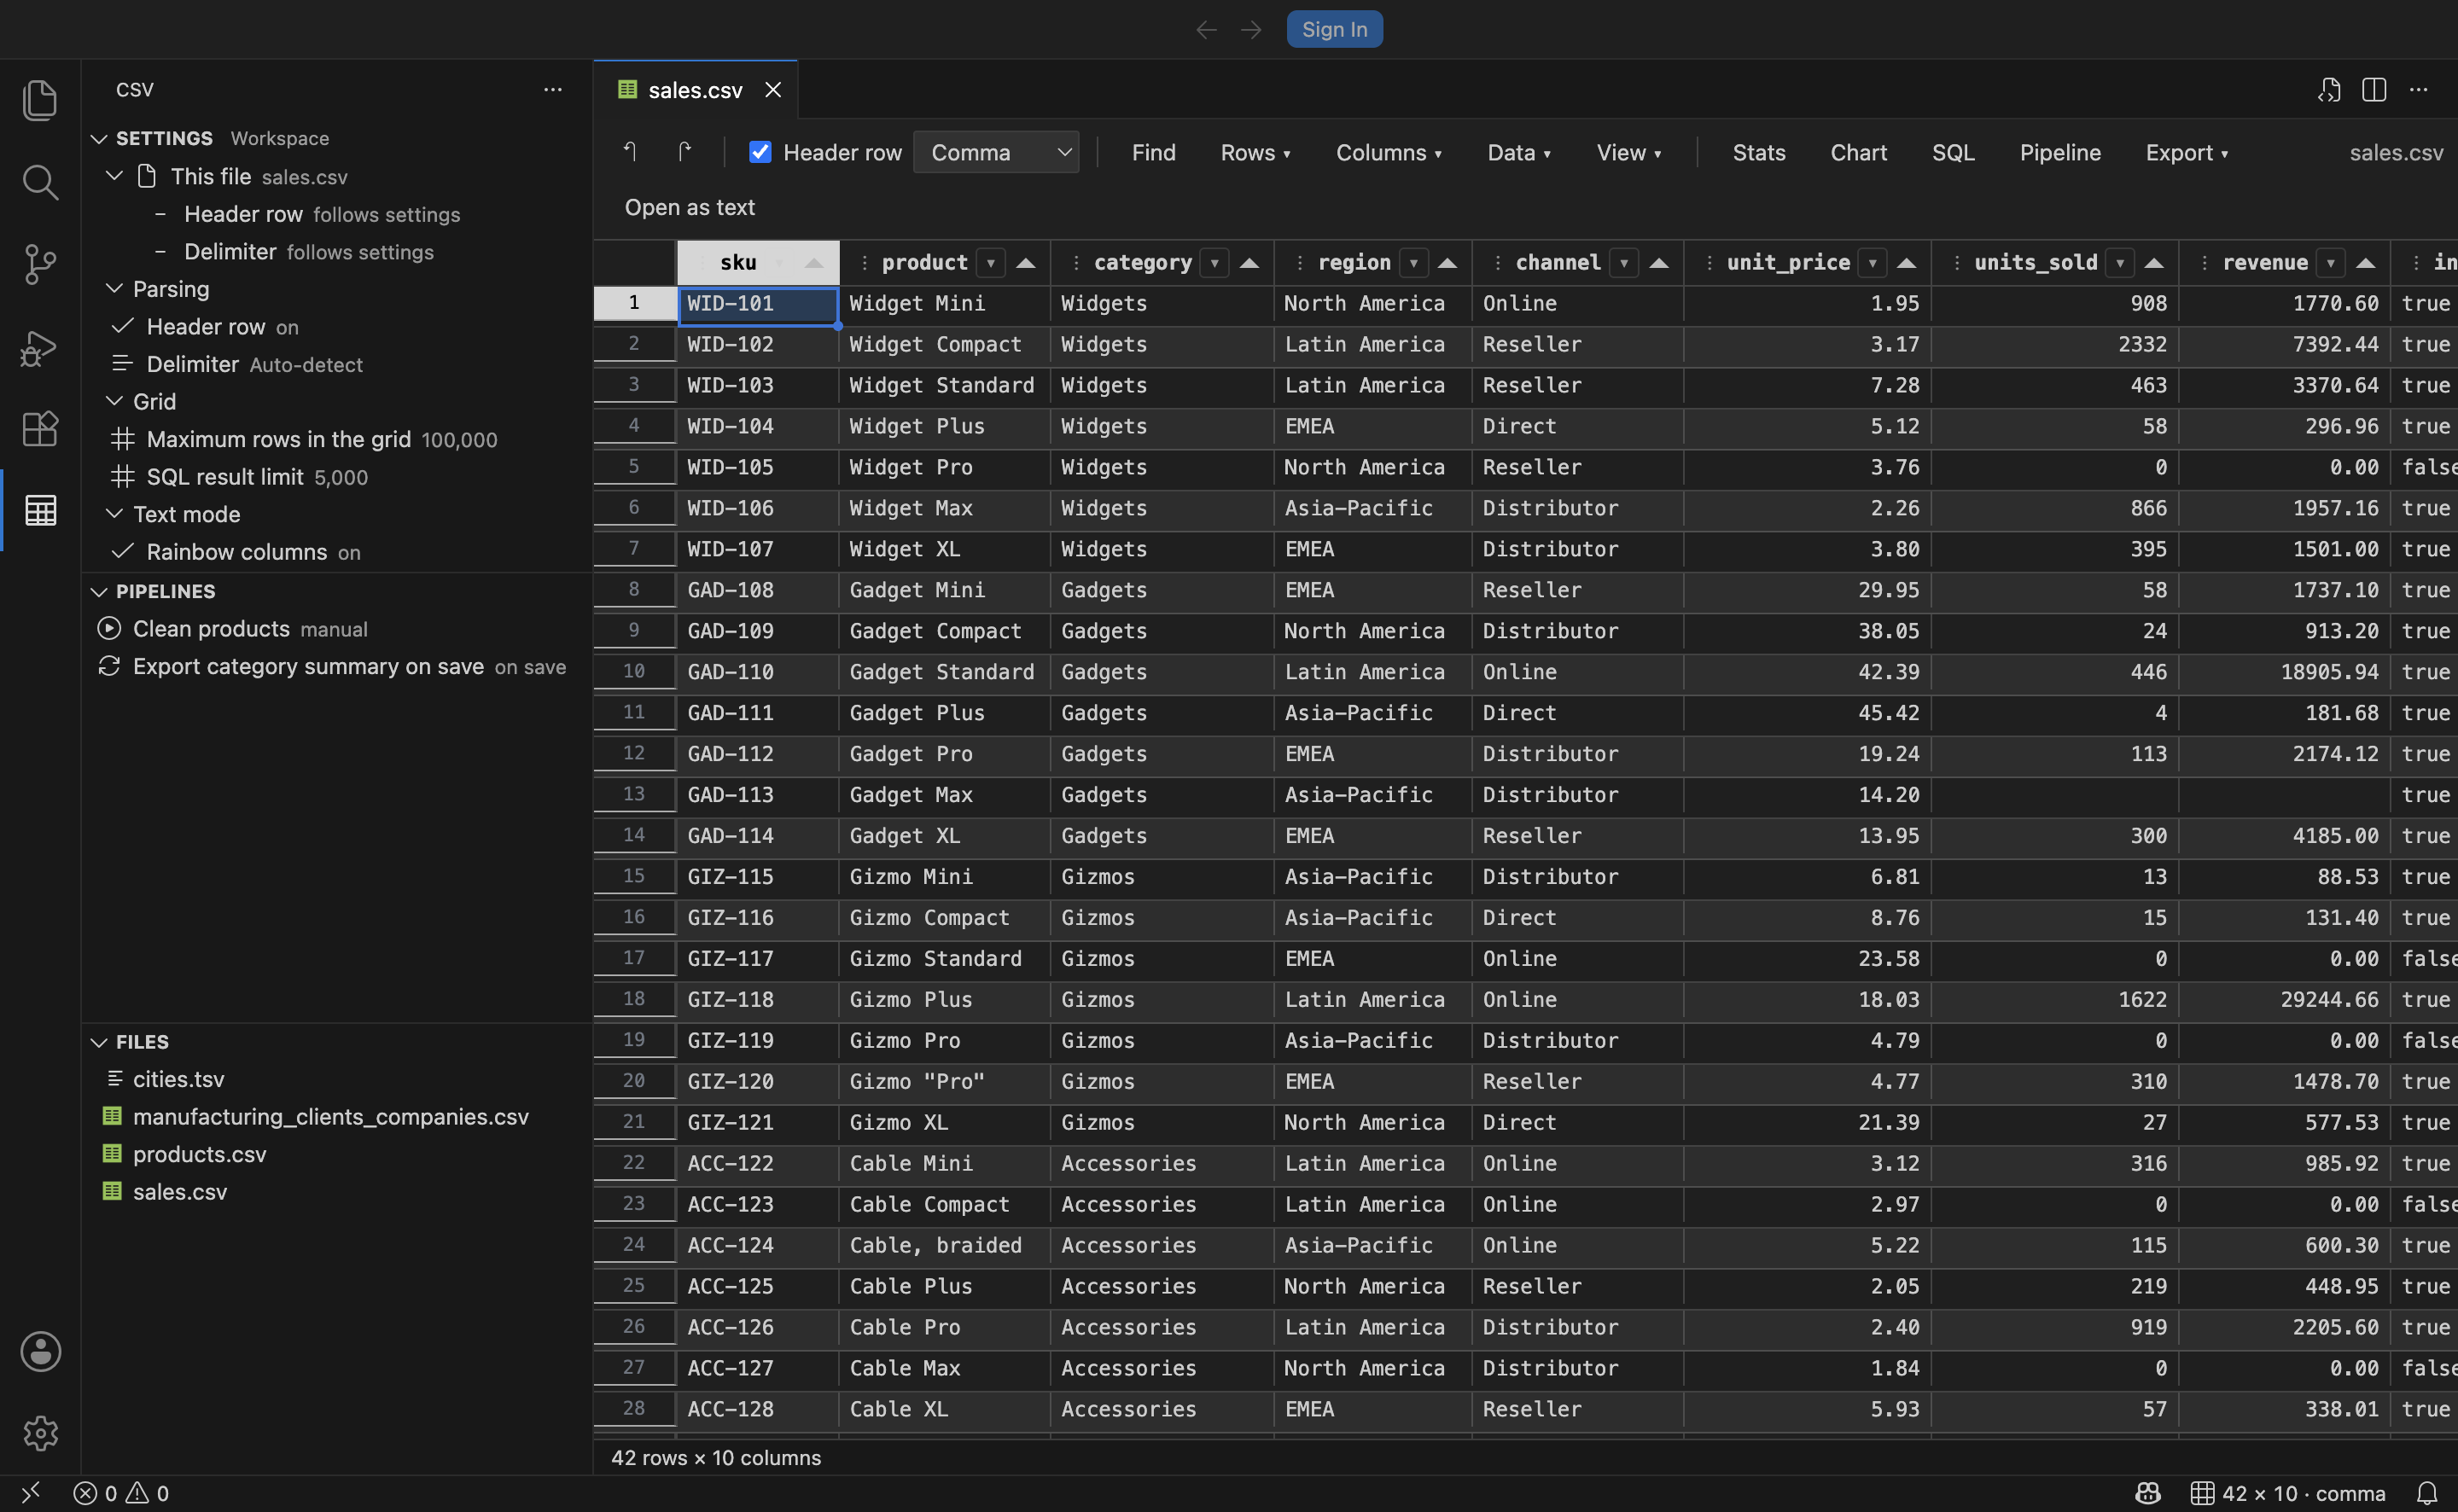
The grid is a custom editor sitting on top of the same text document VS Code already has open. That single design decision is what makes everything else behave:
- Save, undo, redo and the dirty dot are VS Code’s own. An edit in a cell is a text edit on the document.
Ctrl+Zwalks back through it, Git sees a normal diff, and an external change to the file on disk reloads the grid. - Virtualised rendering keeps scrolling smooth well past 100,000 rows.
- Delimiter detection covers comma, tab, semicolon and pipe, with a per-file override in the toolbar.
- Column types are inferred as integer, number, boolean, date or text. The type drives right-aligned numbers, numeric rather than lexical sorting, and which filter operators you are offered.
- Range selection works like a spreadsheet, copies to and pastes from Excel, and puts count, sum, average, minimum and maximum in the status bar.
Excel-style AutoFilter
Section titled “Excel-style AutoFilter”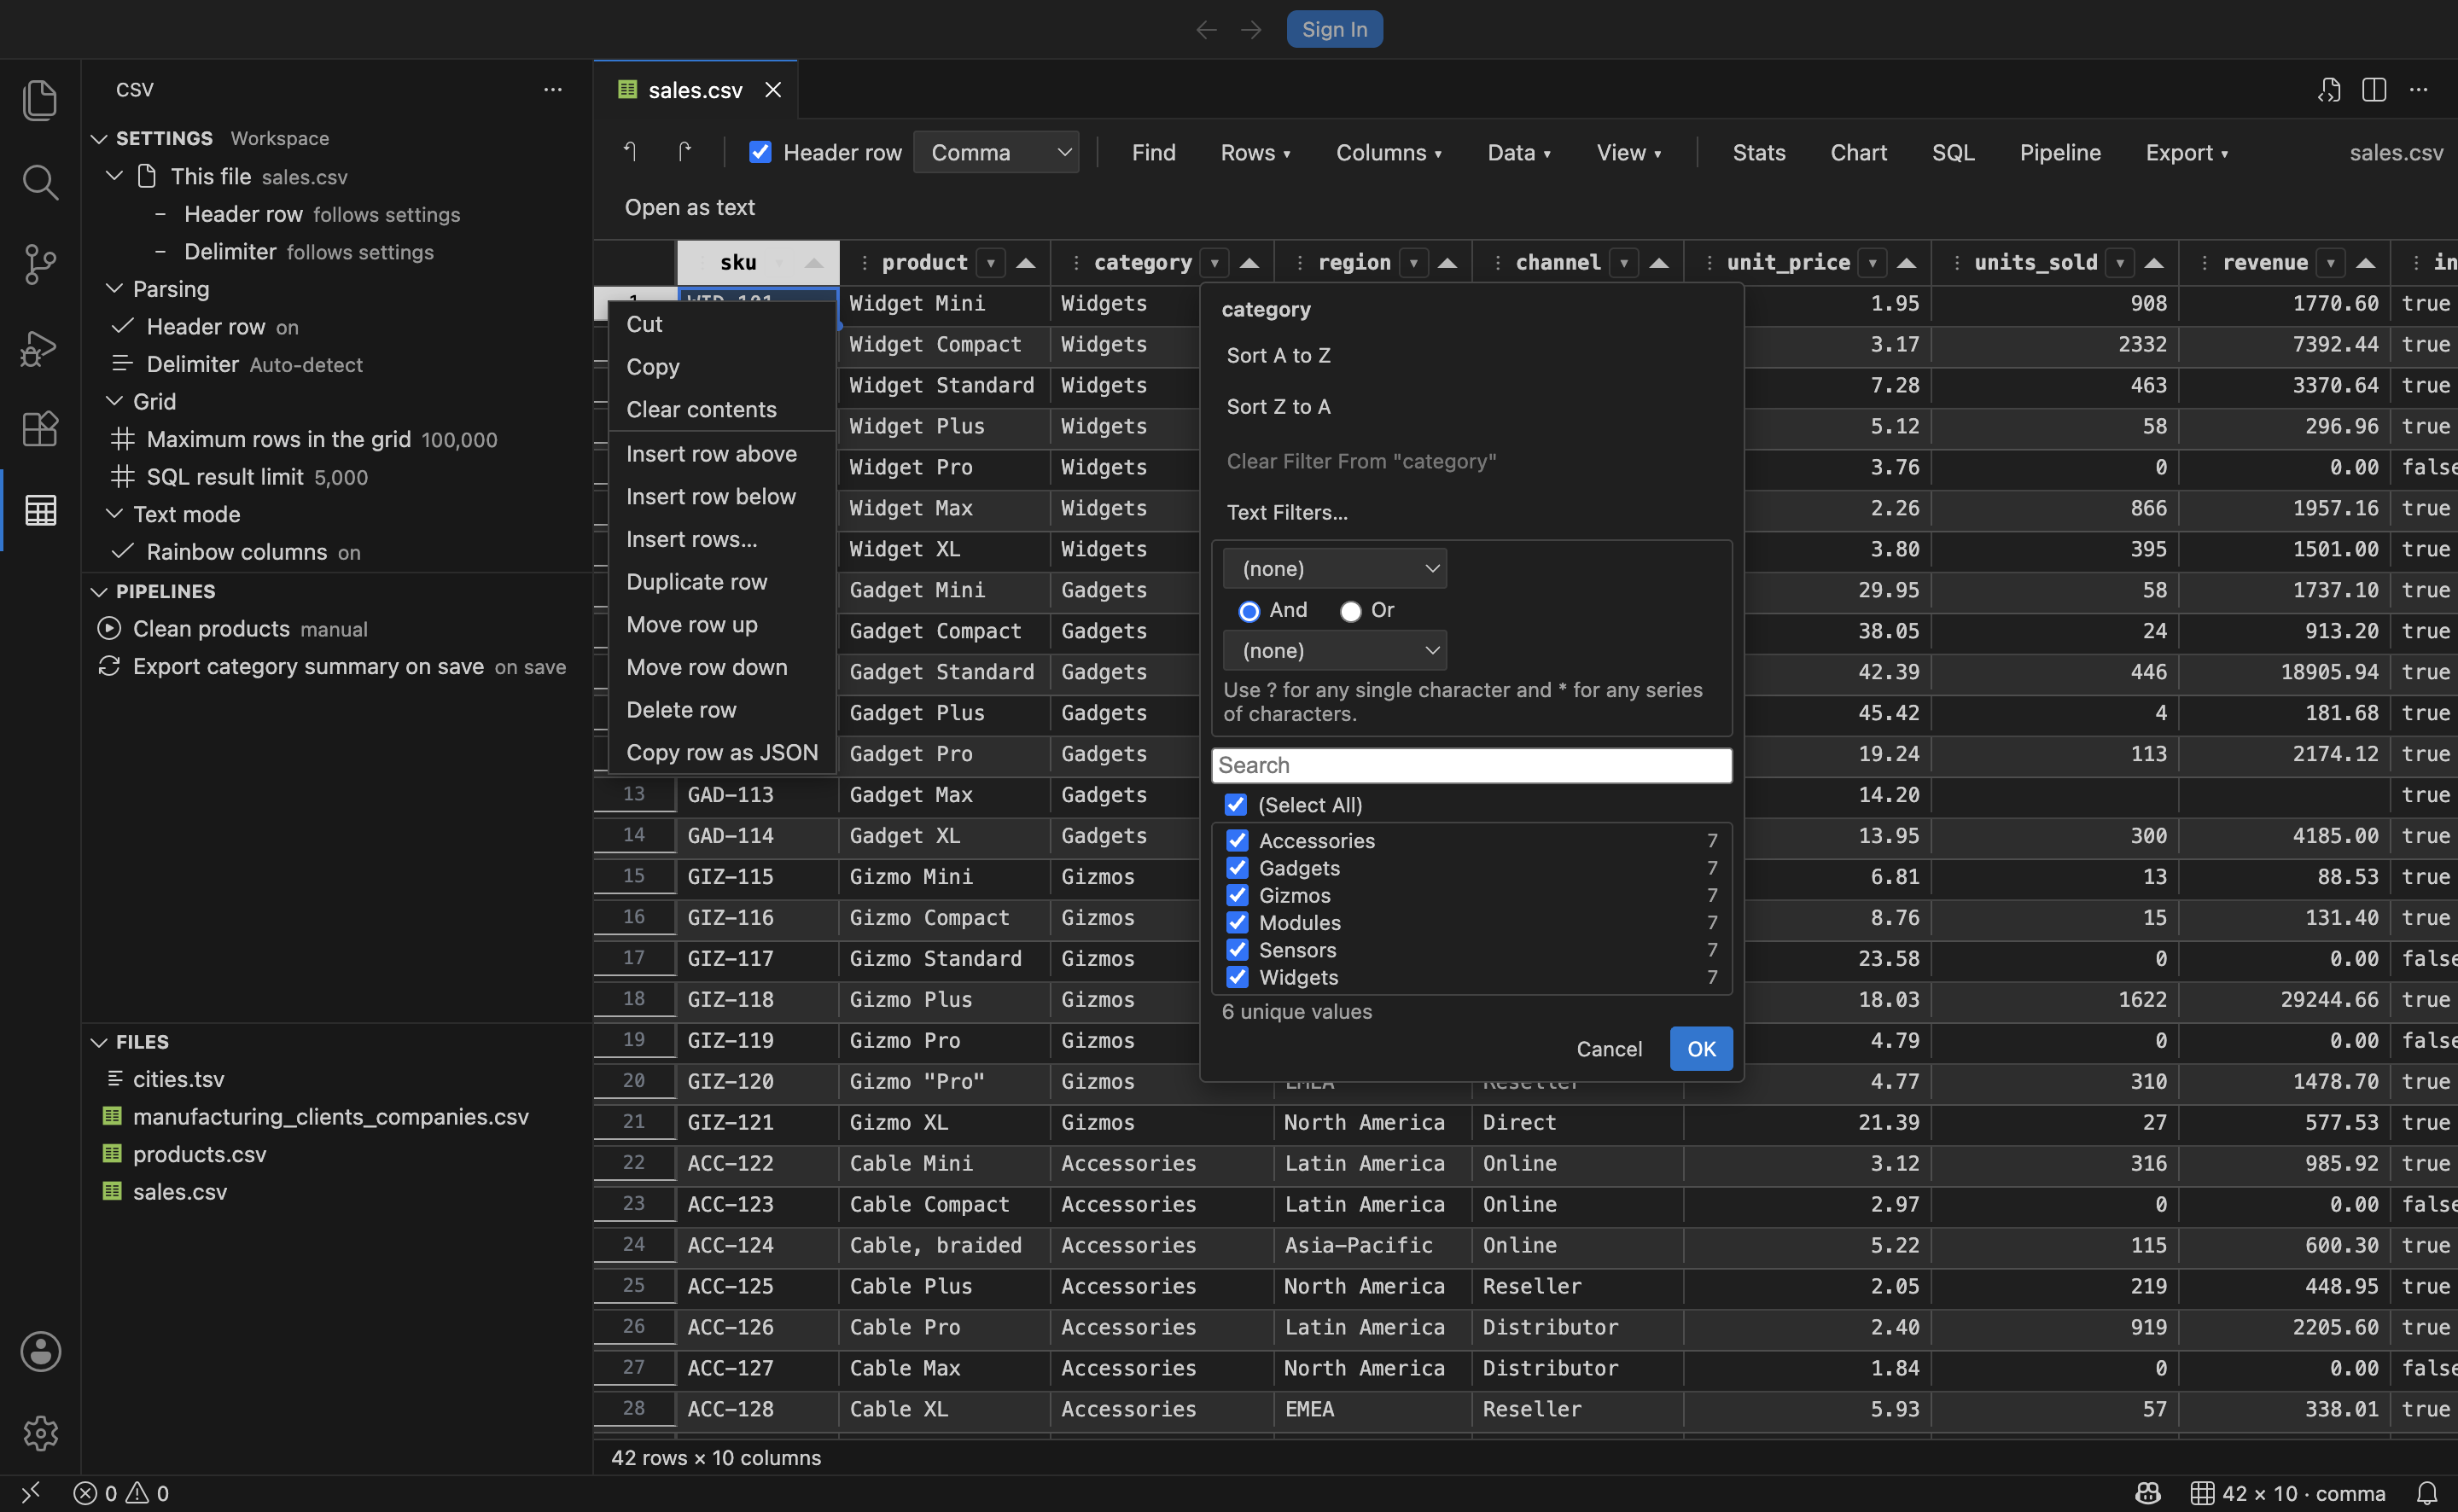
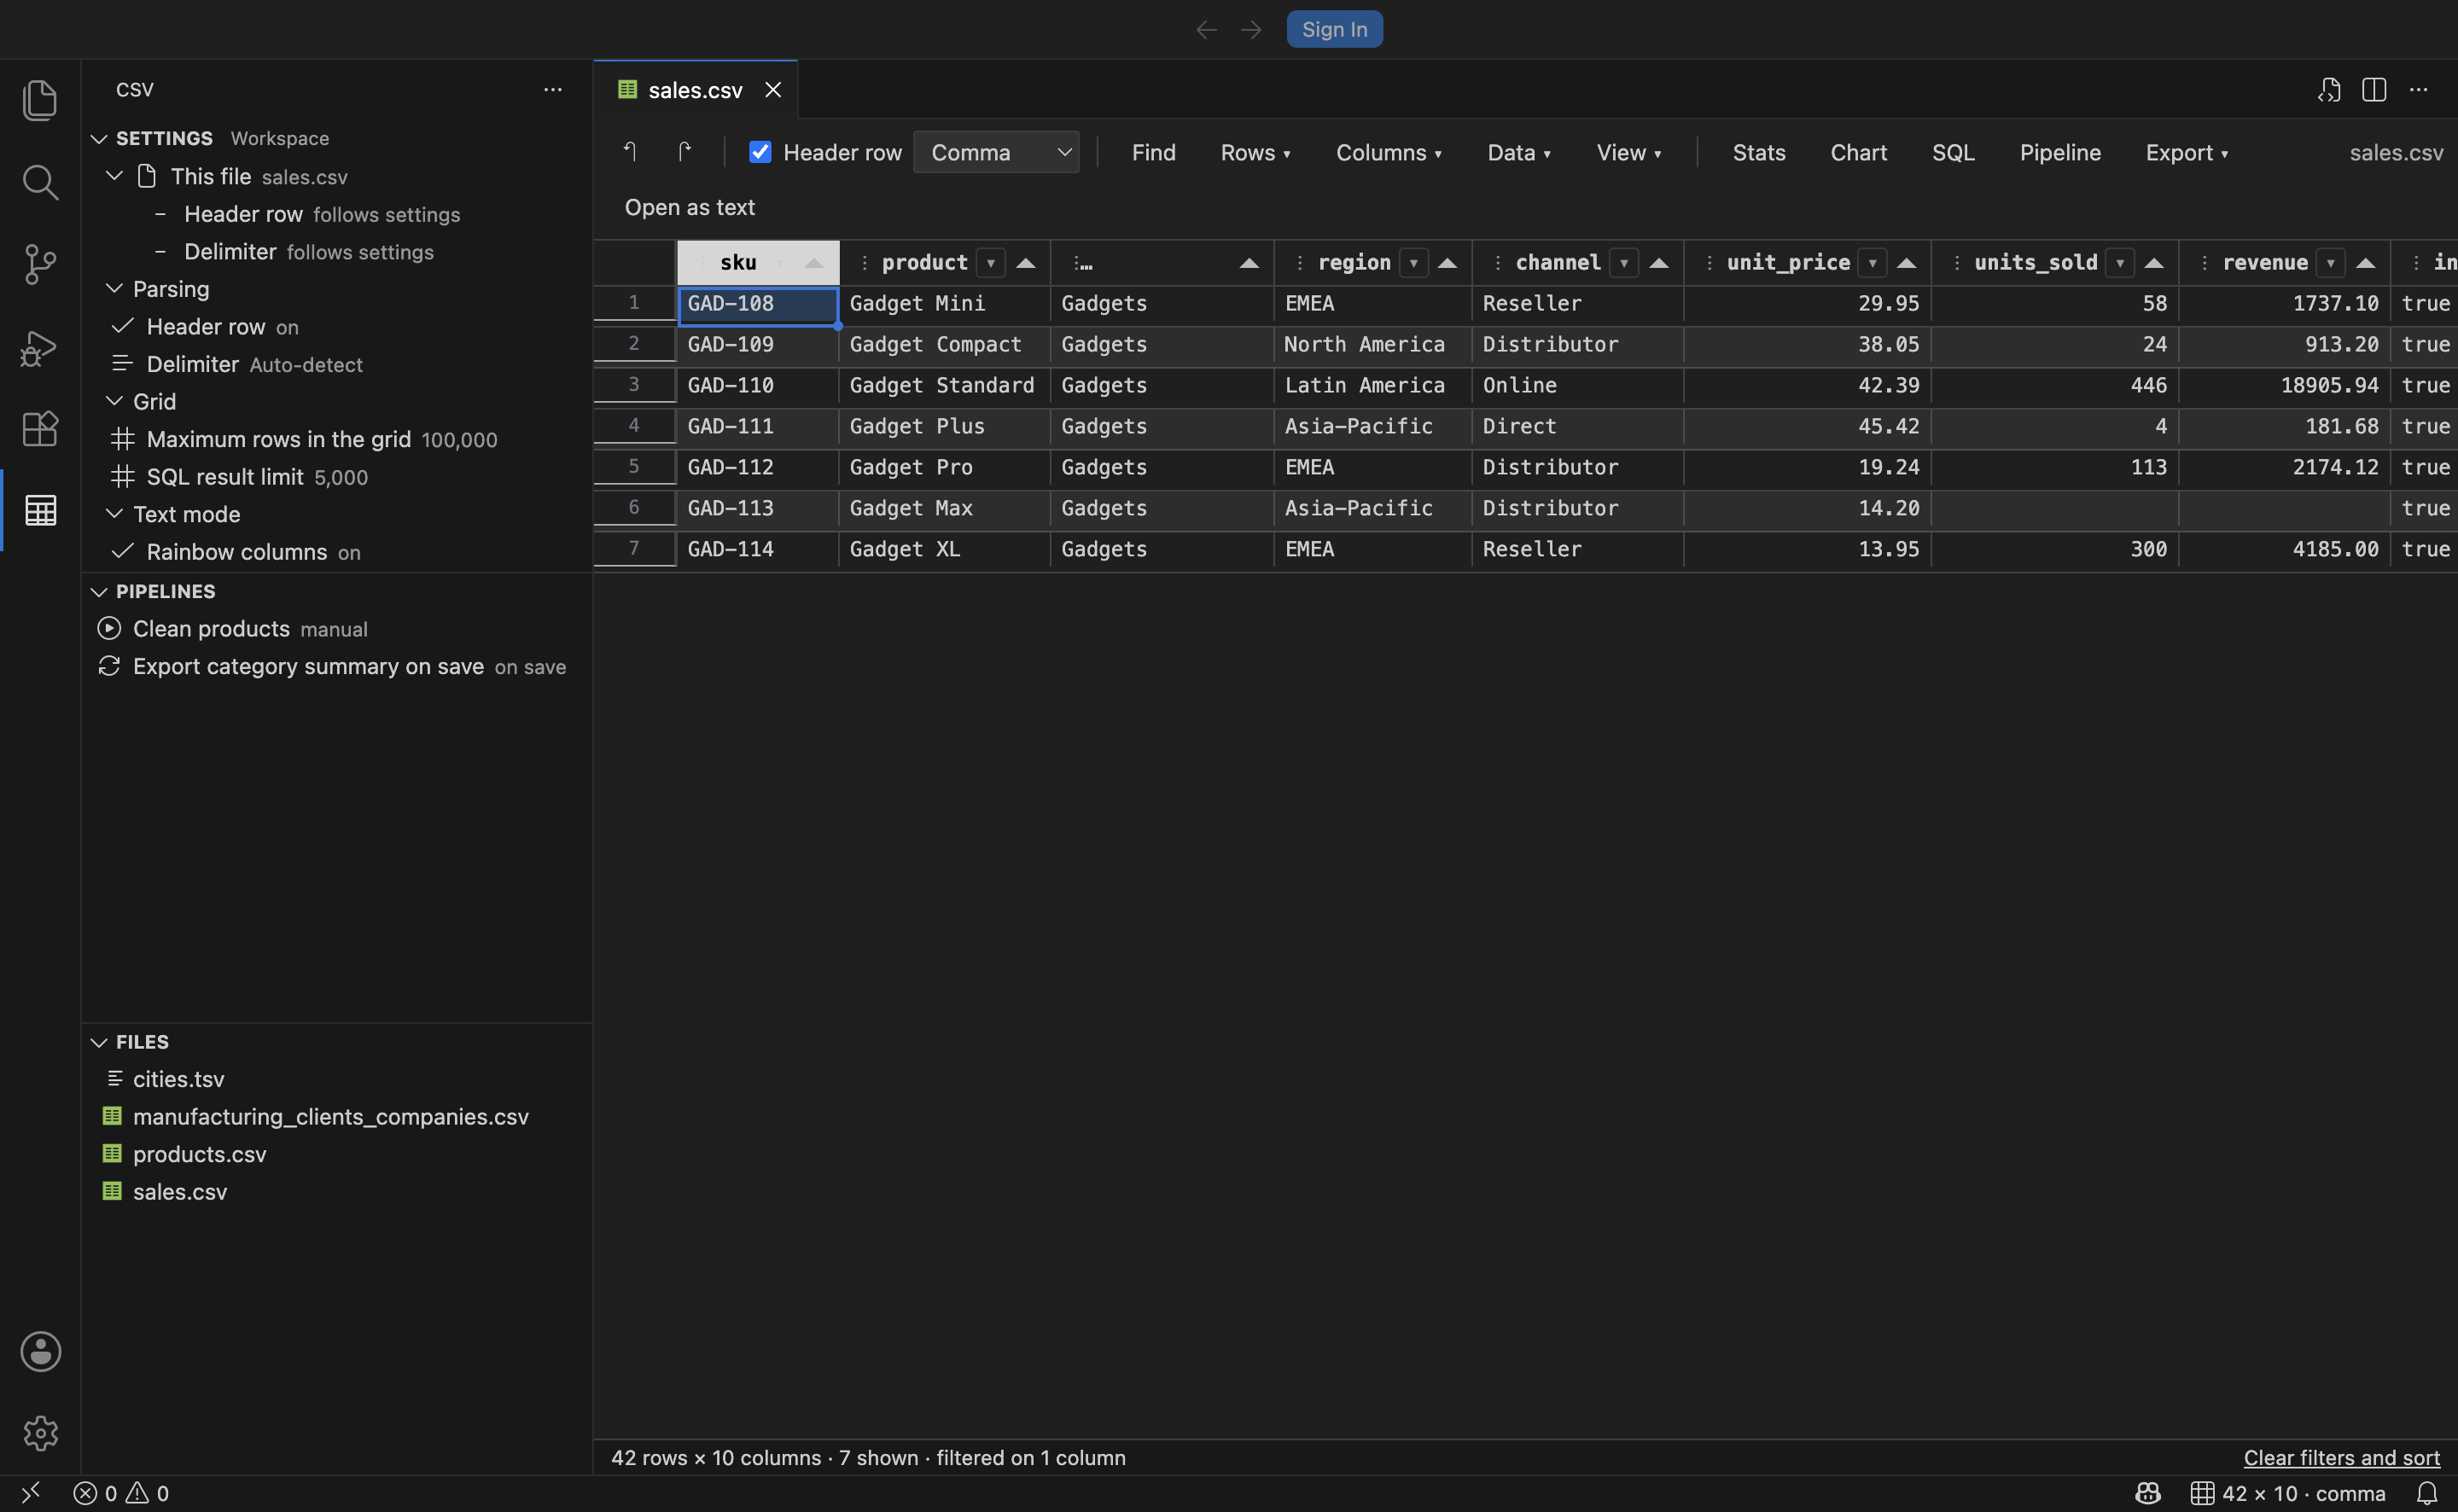
Click the caret in any column header, or press Alt+Down. You get the dropdown you already know:
- A searchable list of distinct values with row counts, tri-state
(Select All)and an explicit(Blanks)entry. - Condition filters appropriate to the column’s type — contains, begins with, greater than, between, before, is empty — two at a time, joined by And or Or, with
*and?wildcards. - Cascading value lists. The values on offer reflect the filters already applied to other columns, so you can never pick a combination that matches zero rows.
- Sorting, and a one-click clear per column.
Find, replace and sort
Section titled “Find, replace and sort”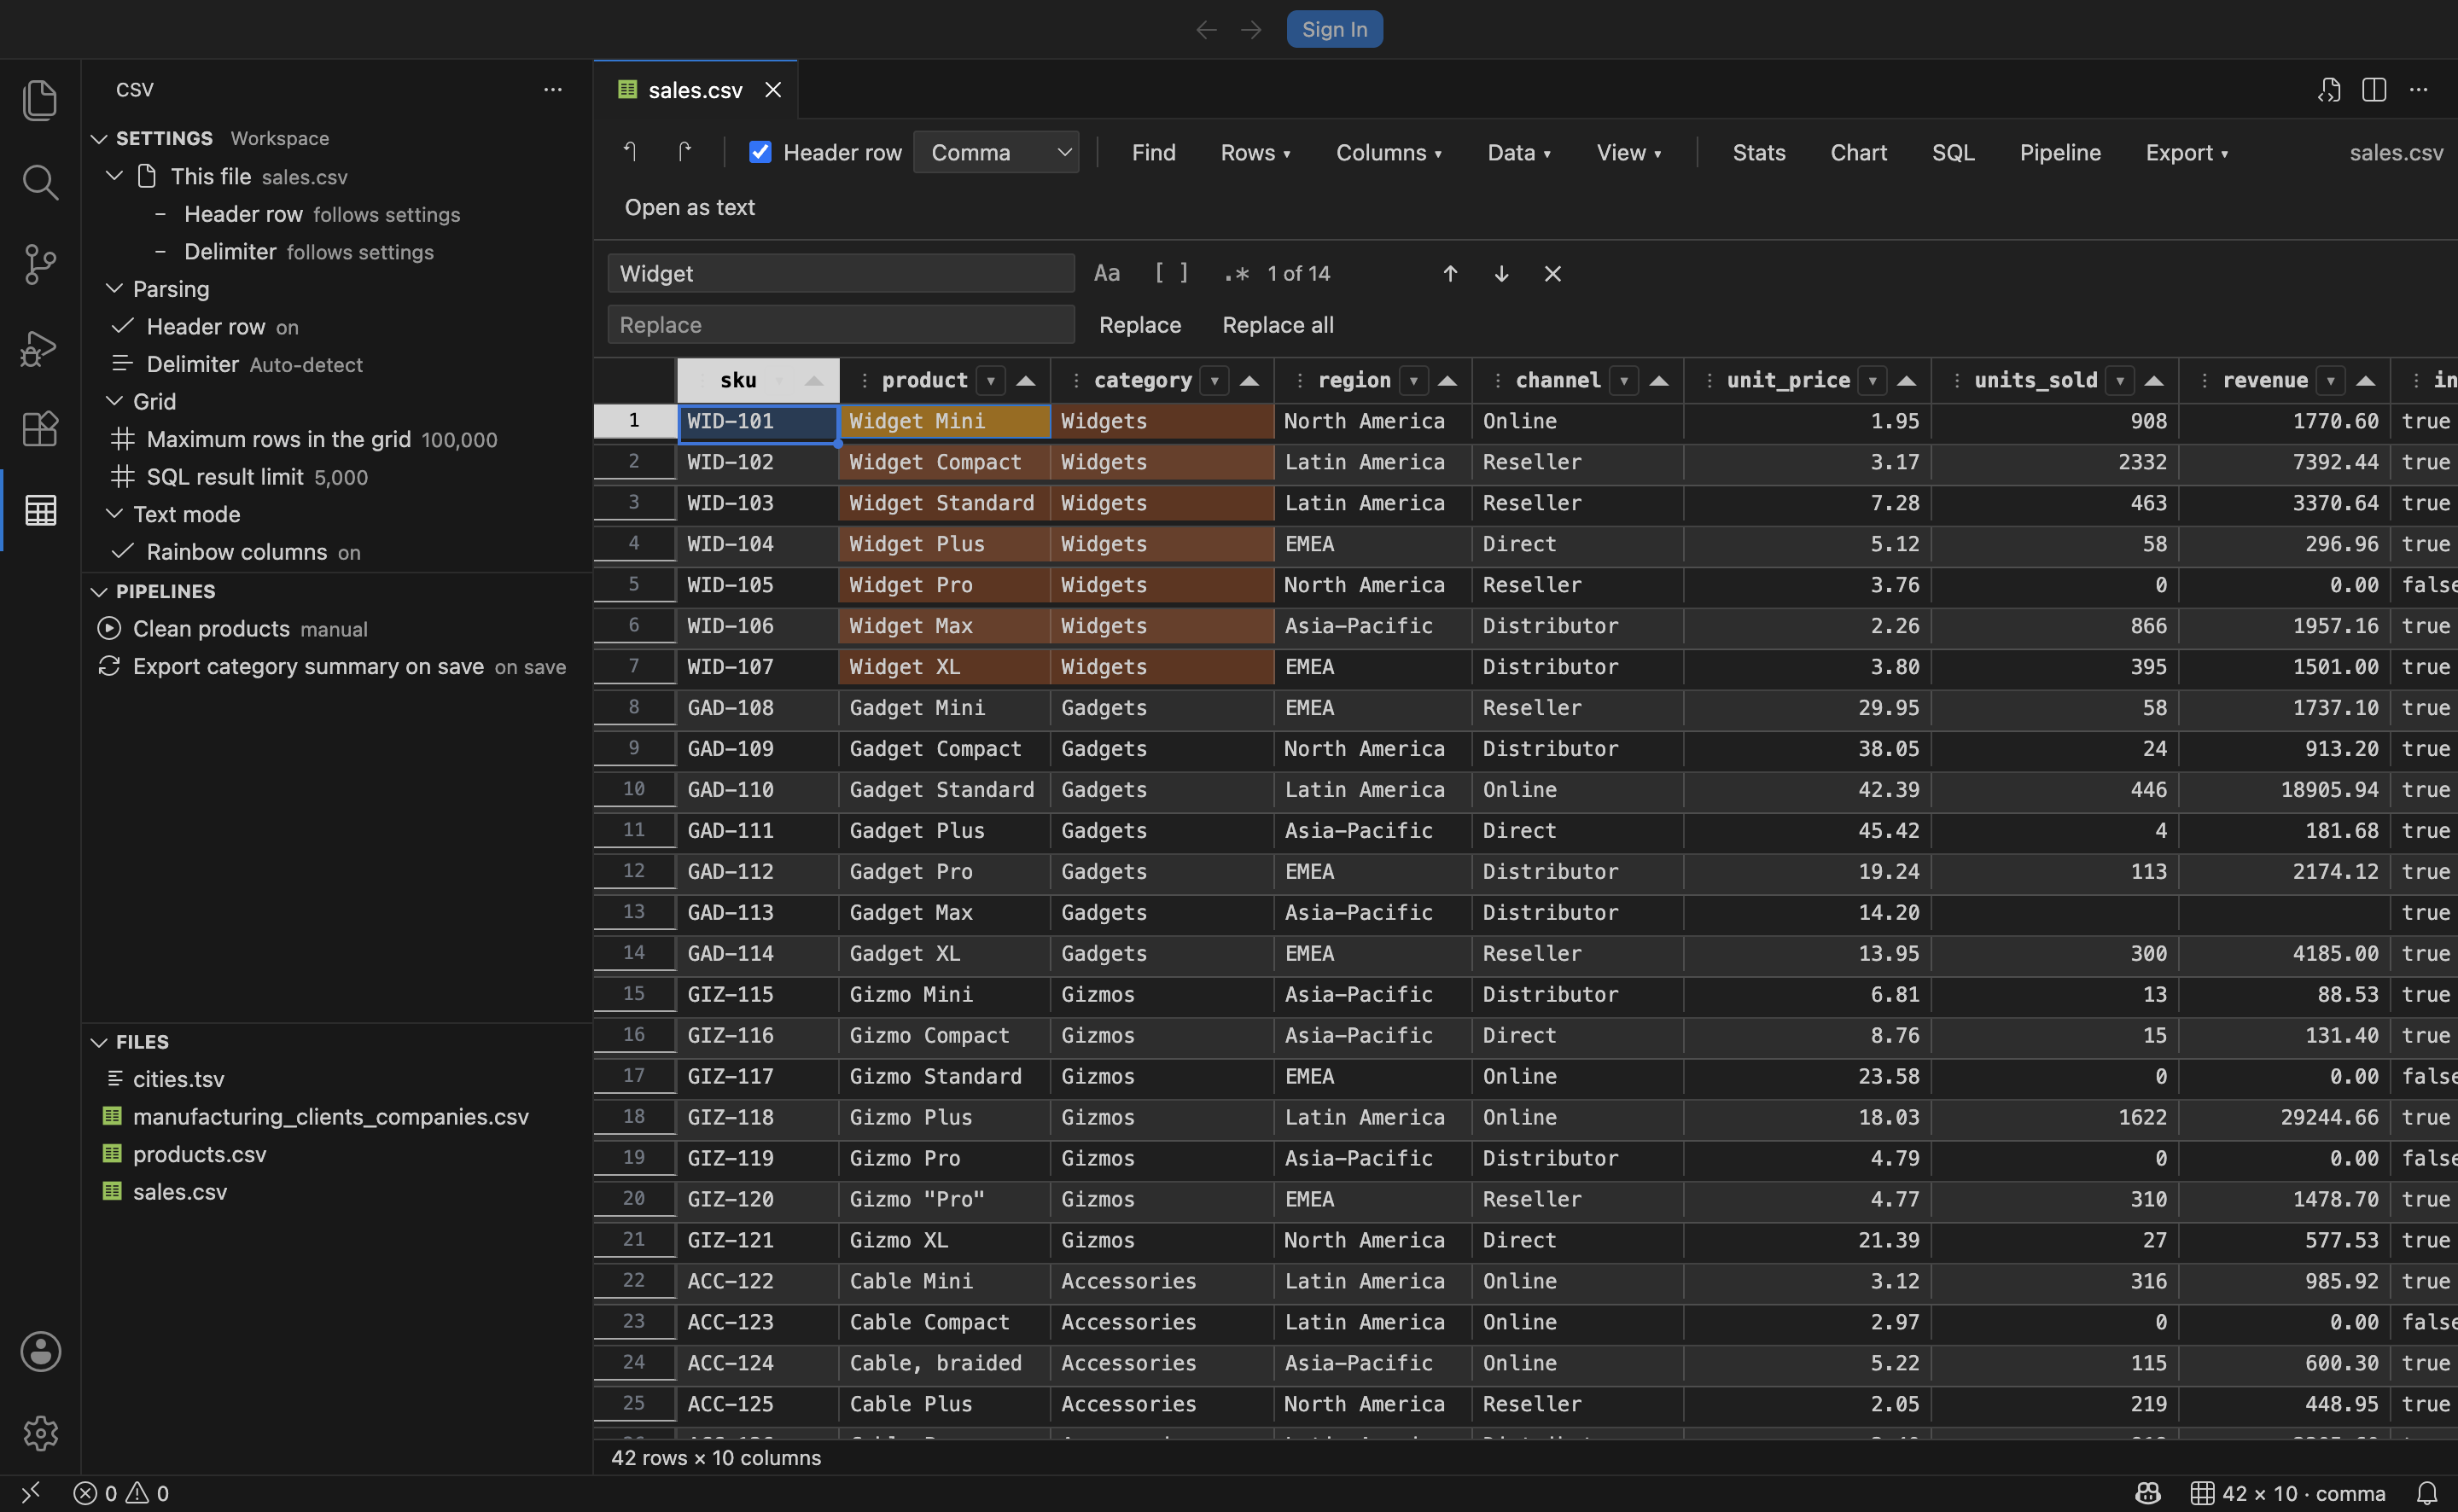
Ctrl+F opens find and replace over cells rather than over text: match case, whole cell and regular expression modes, live highlighting of every match, next and previous, and a replace-all that lands as one undo step.
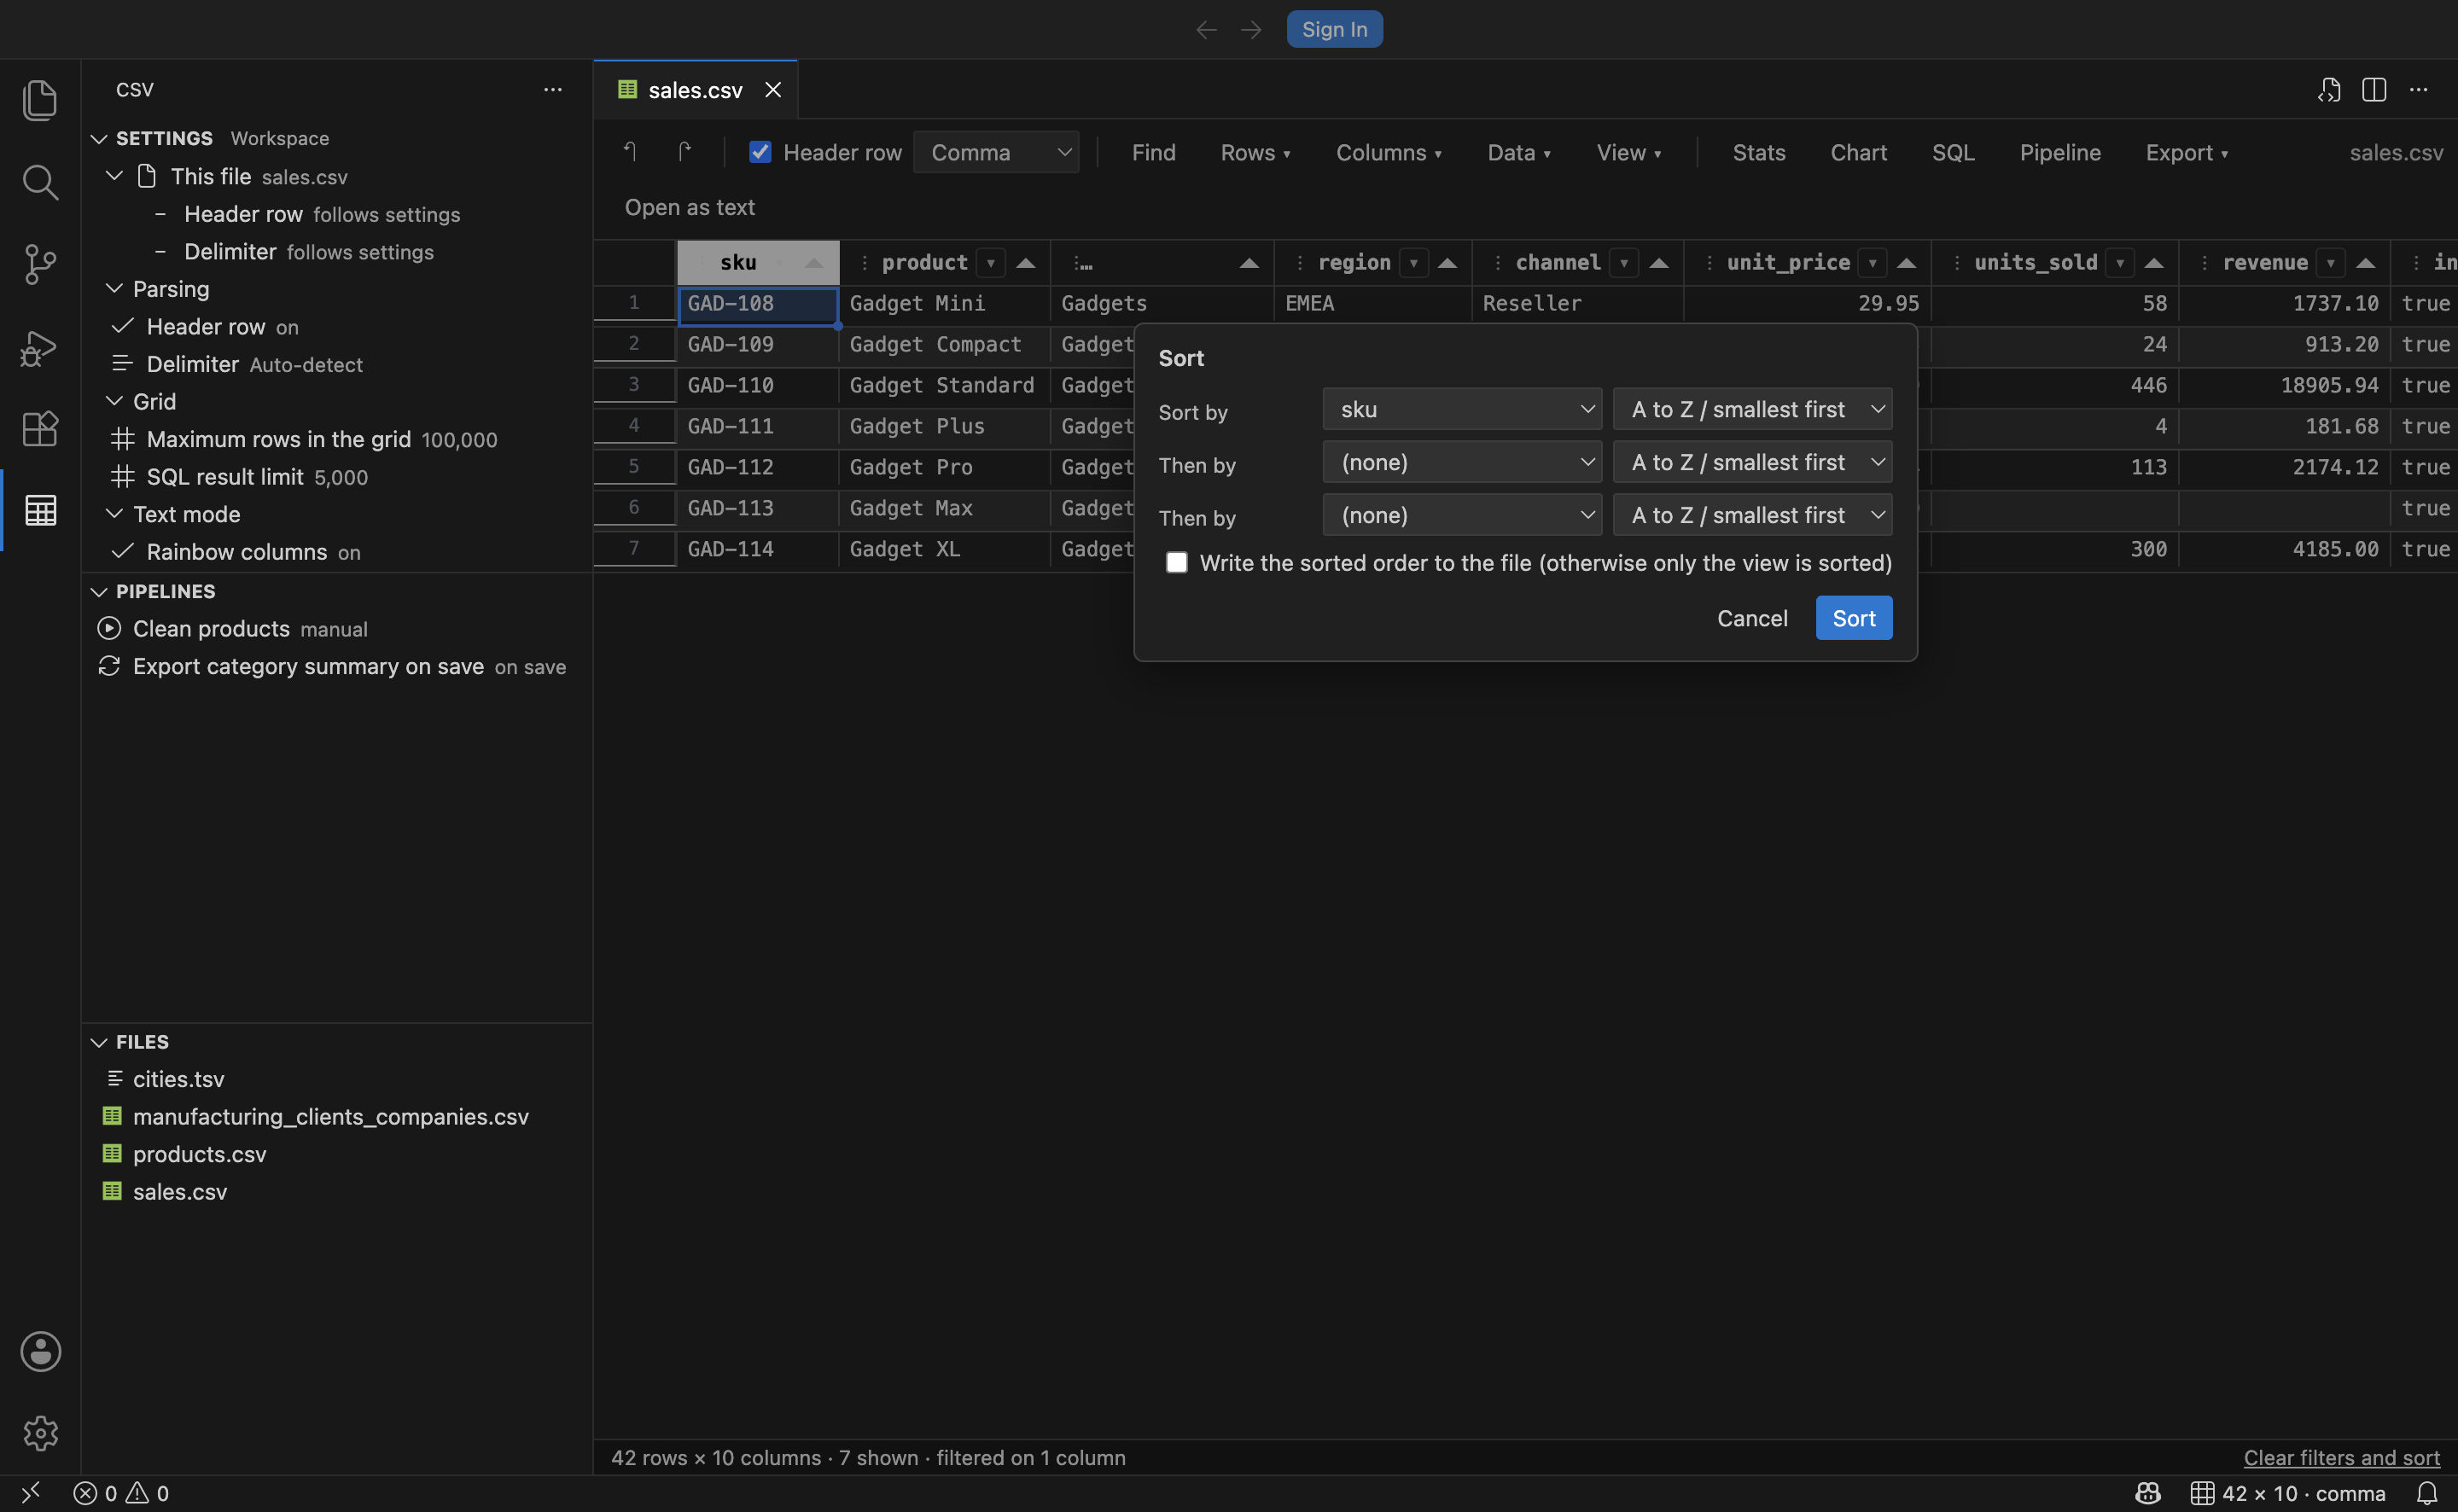
The Sort dialog does up to three levels and asks the question that matters: sort the view, or write the new row order to the file.
Row and column surgery
Section titled “Row and column surgery”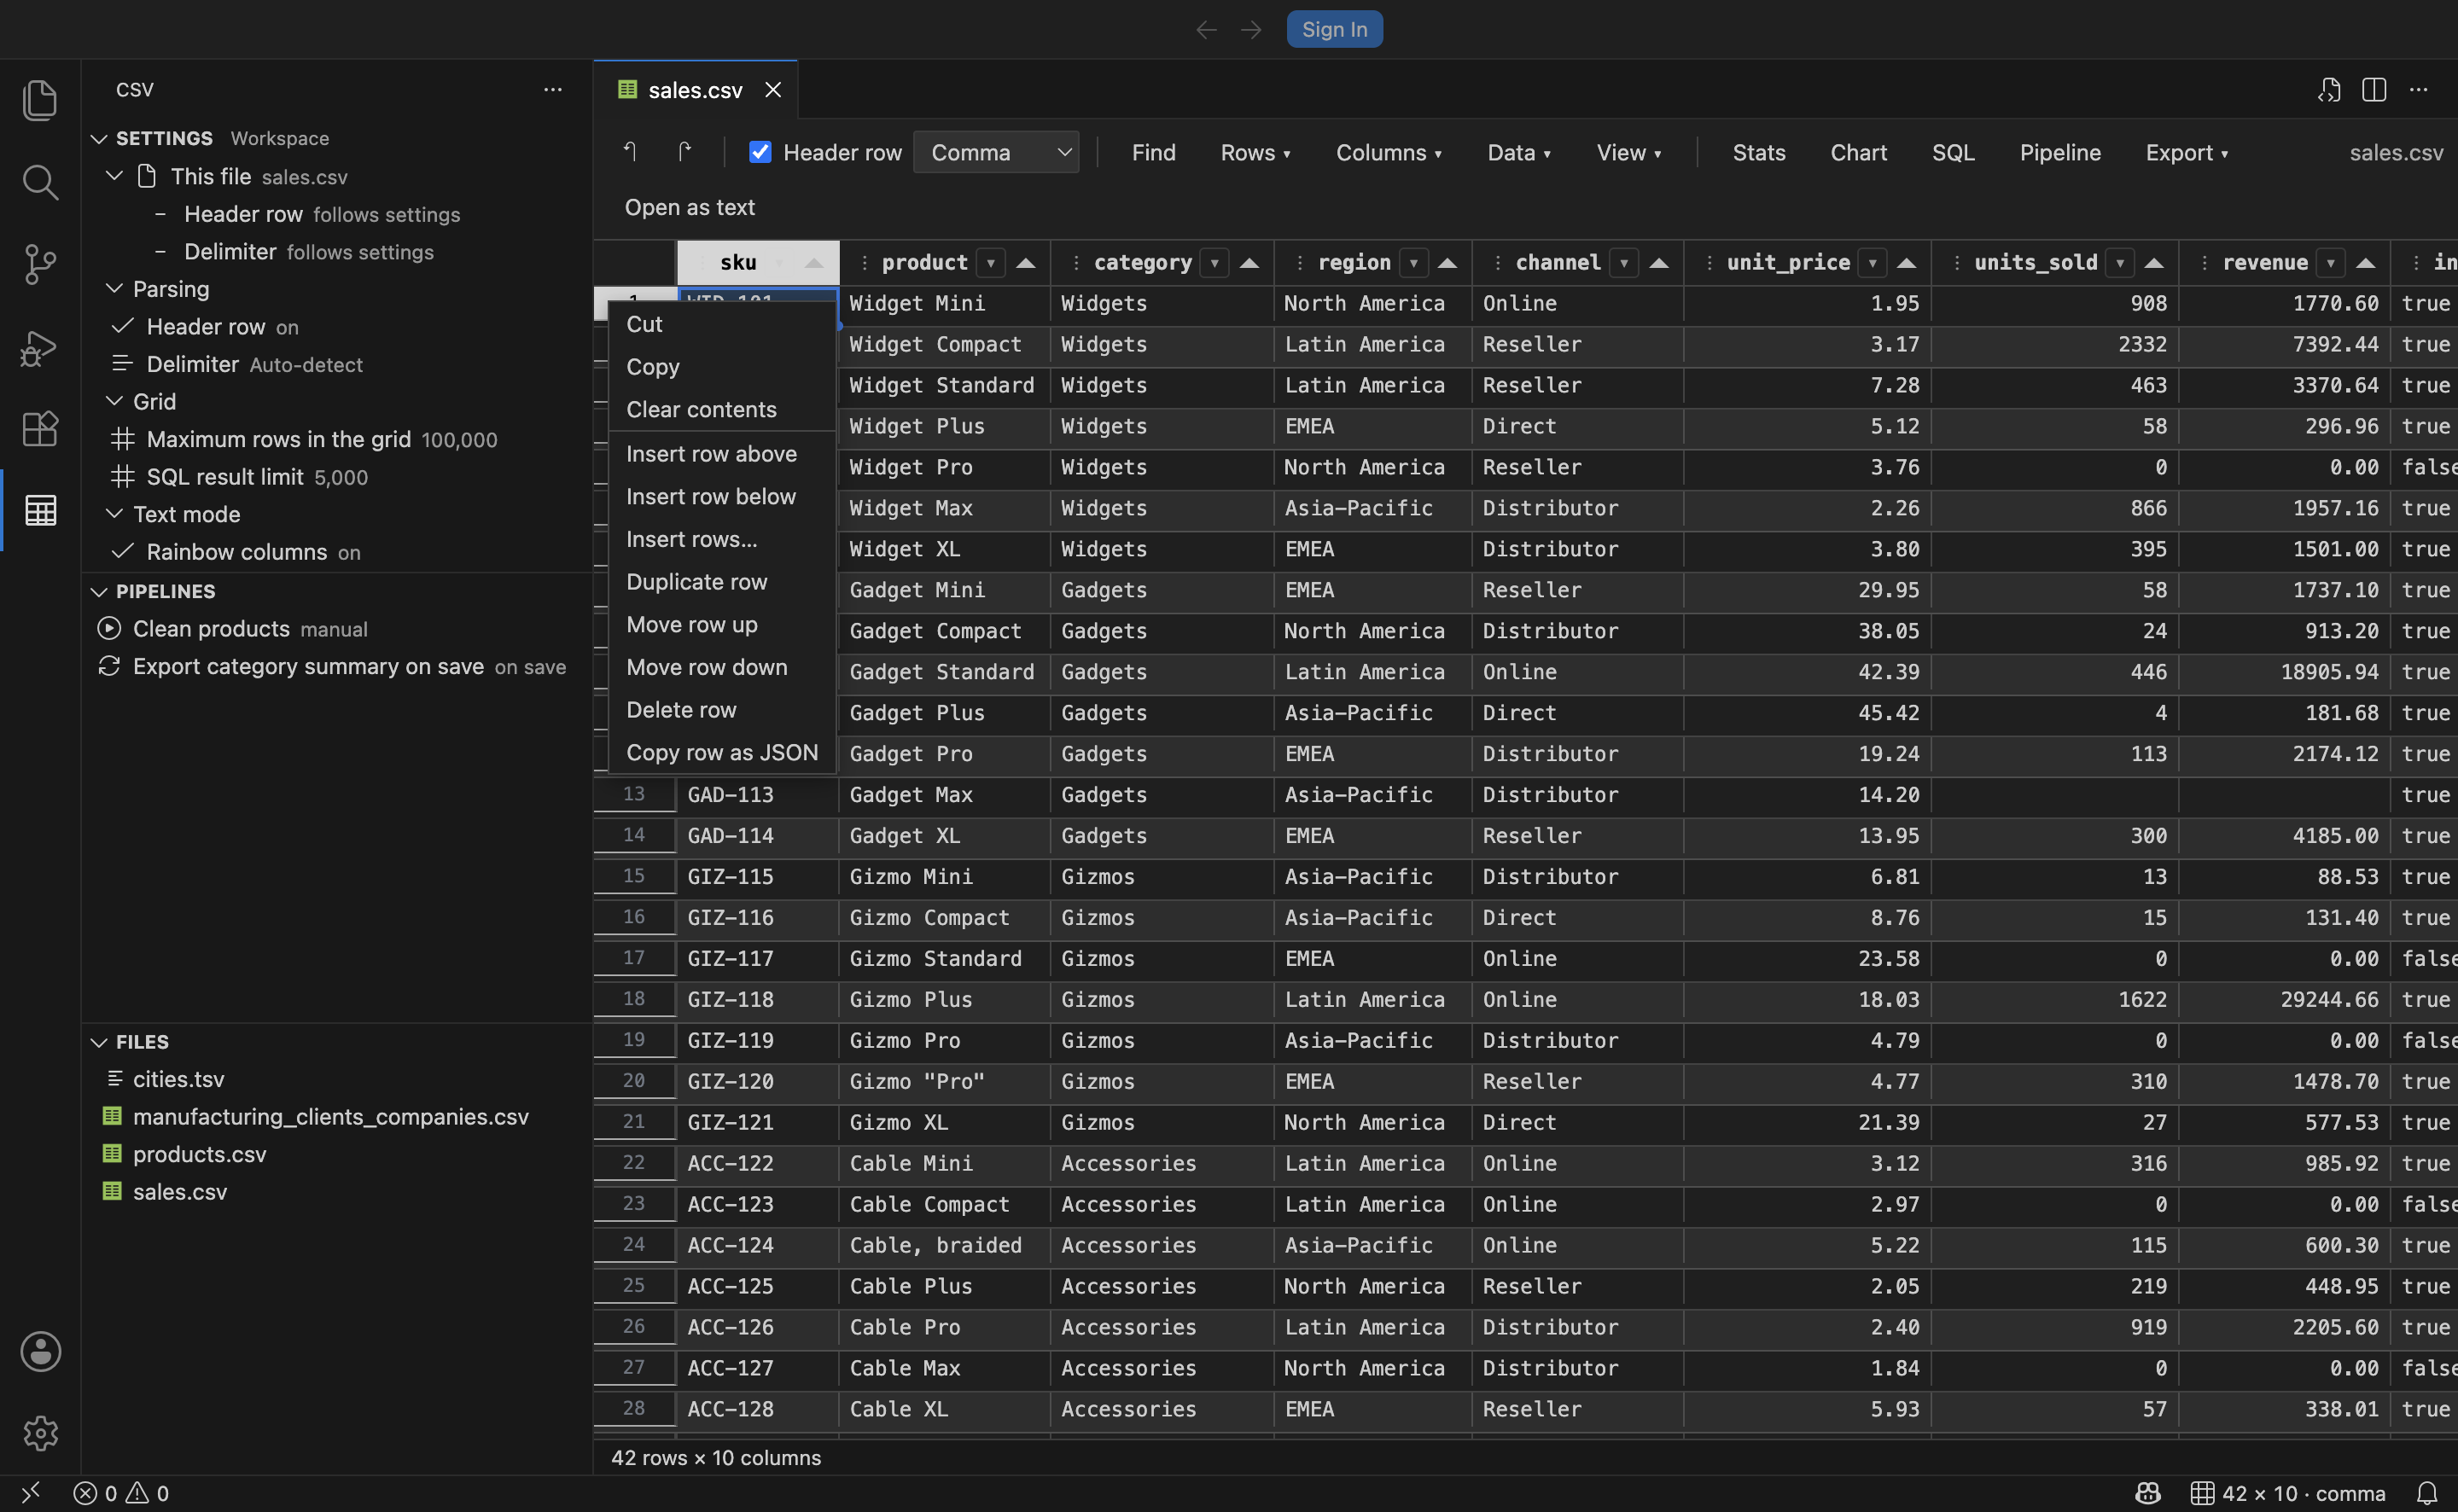
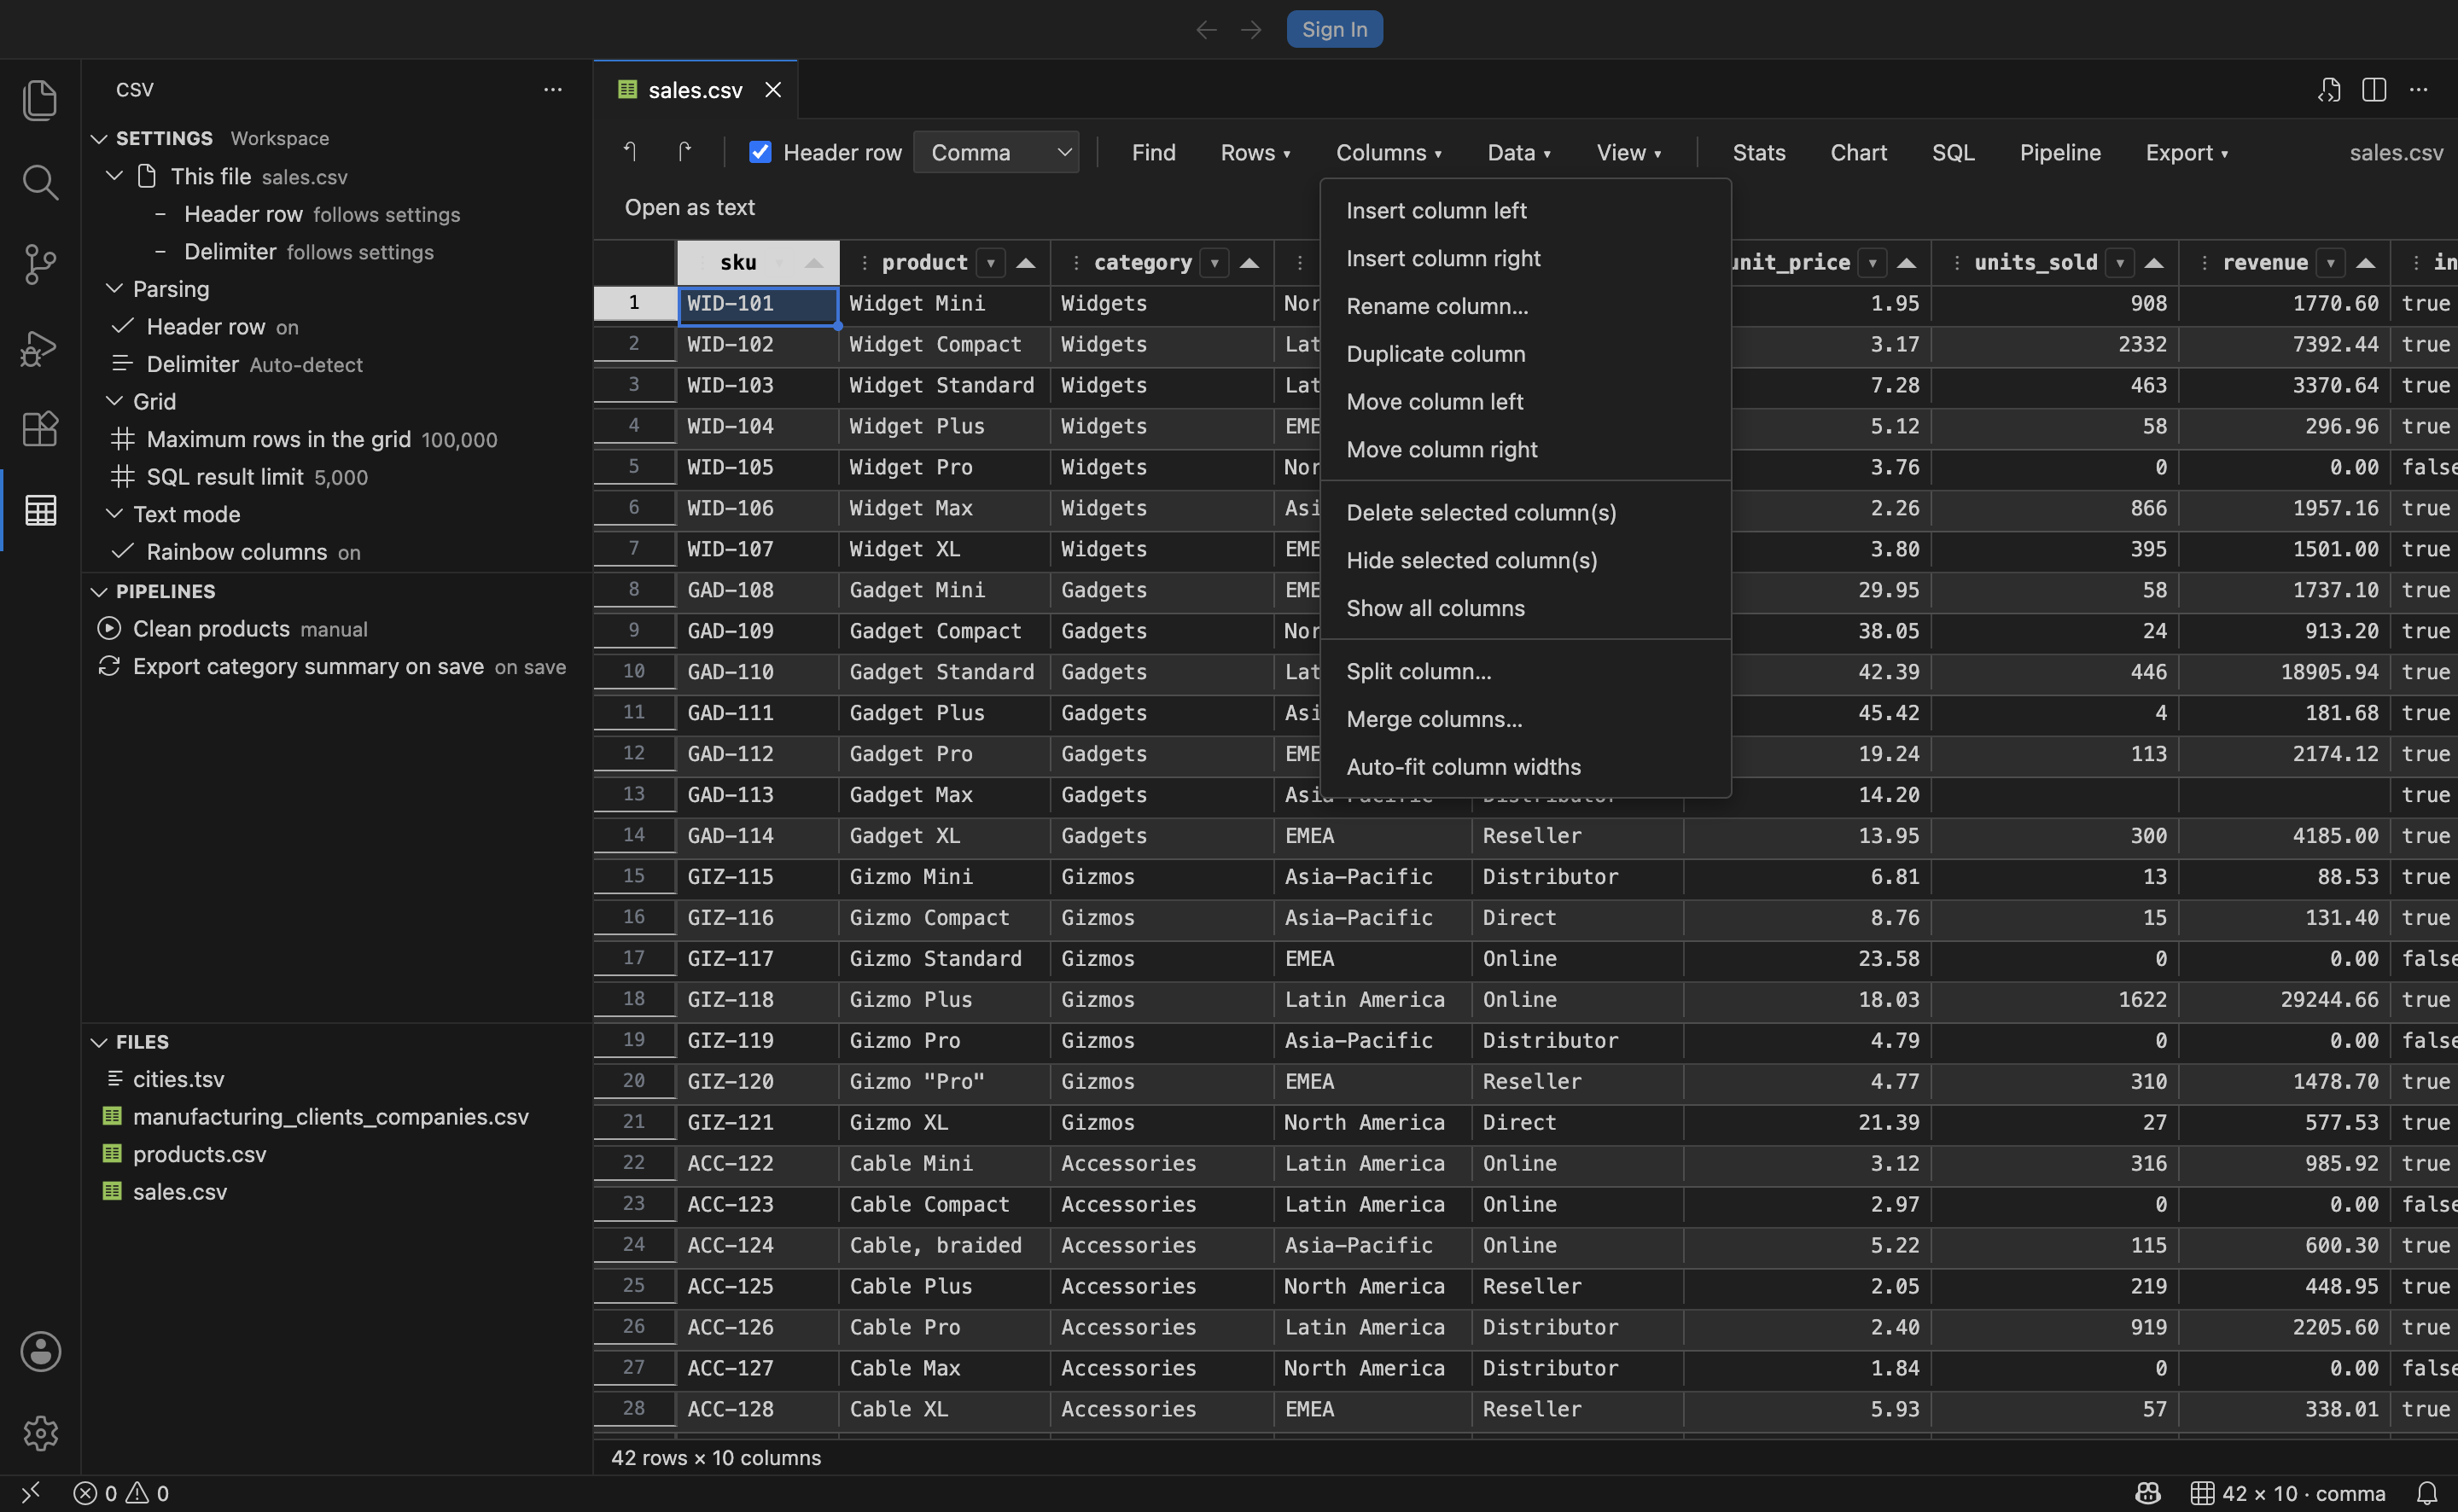
Insert, duplicate, move, delete and hide — for rows and columns, on a single item or a whole selection. Beyond that, the operations you would otherwise open a spreadsheet for:
Reshape
Split one column into several on a delimiter or a width. Merge several into one with a separator. Transpose the entire table.
Clean
Remove empty rows, remove duplicate rows, trim whitespace, change case, and normalize rows whose field count does not match the header.
Fill
Fill down with Ctrl+D and right with Ctrl+R, or fill a series — numbers, dates, or a repeating pattern.
Statistics
Section titled “Statistics”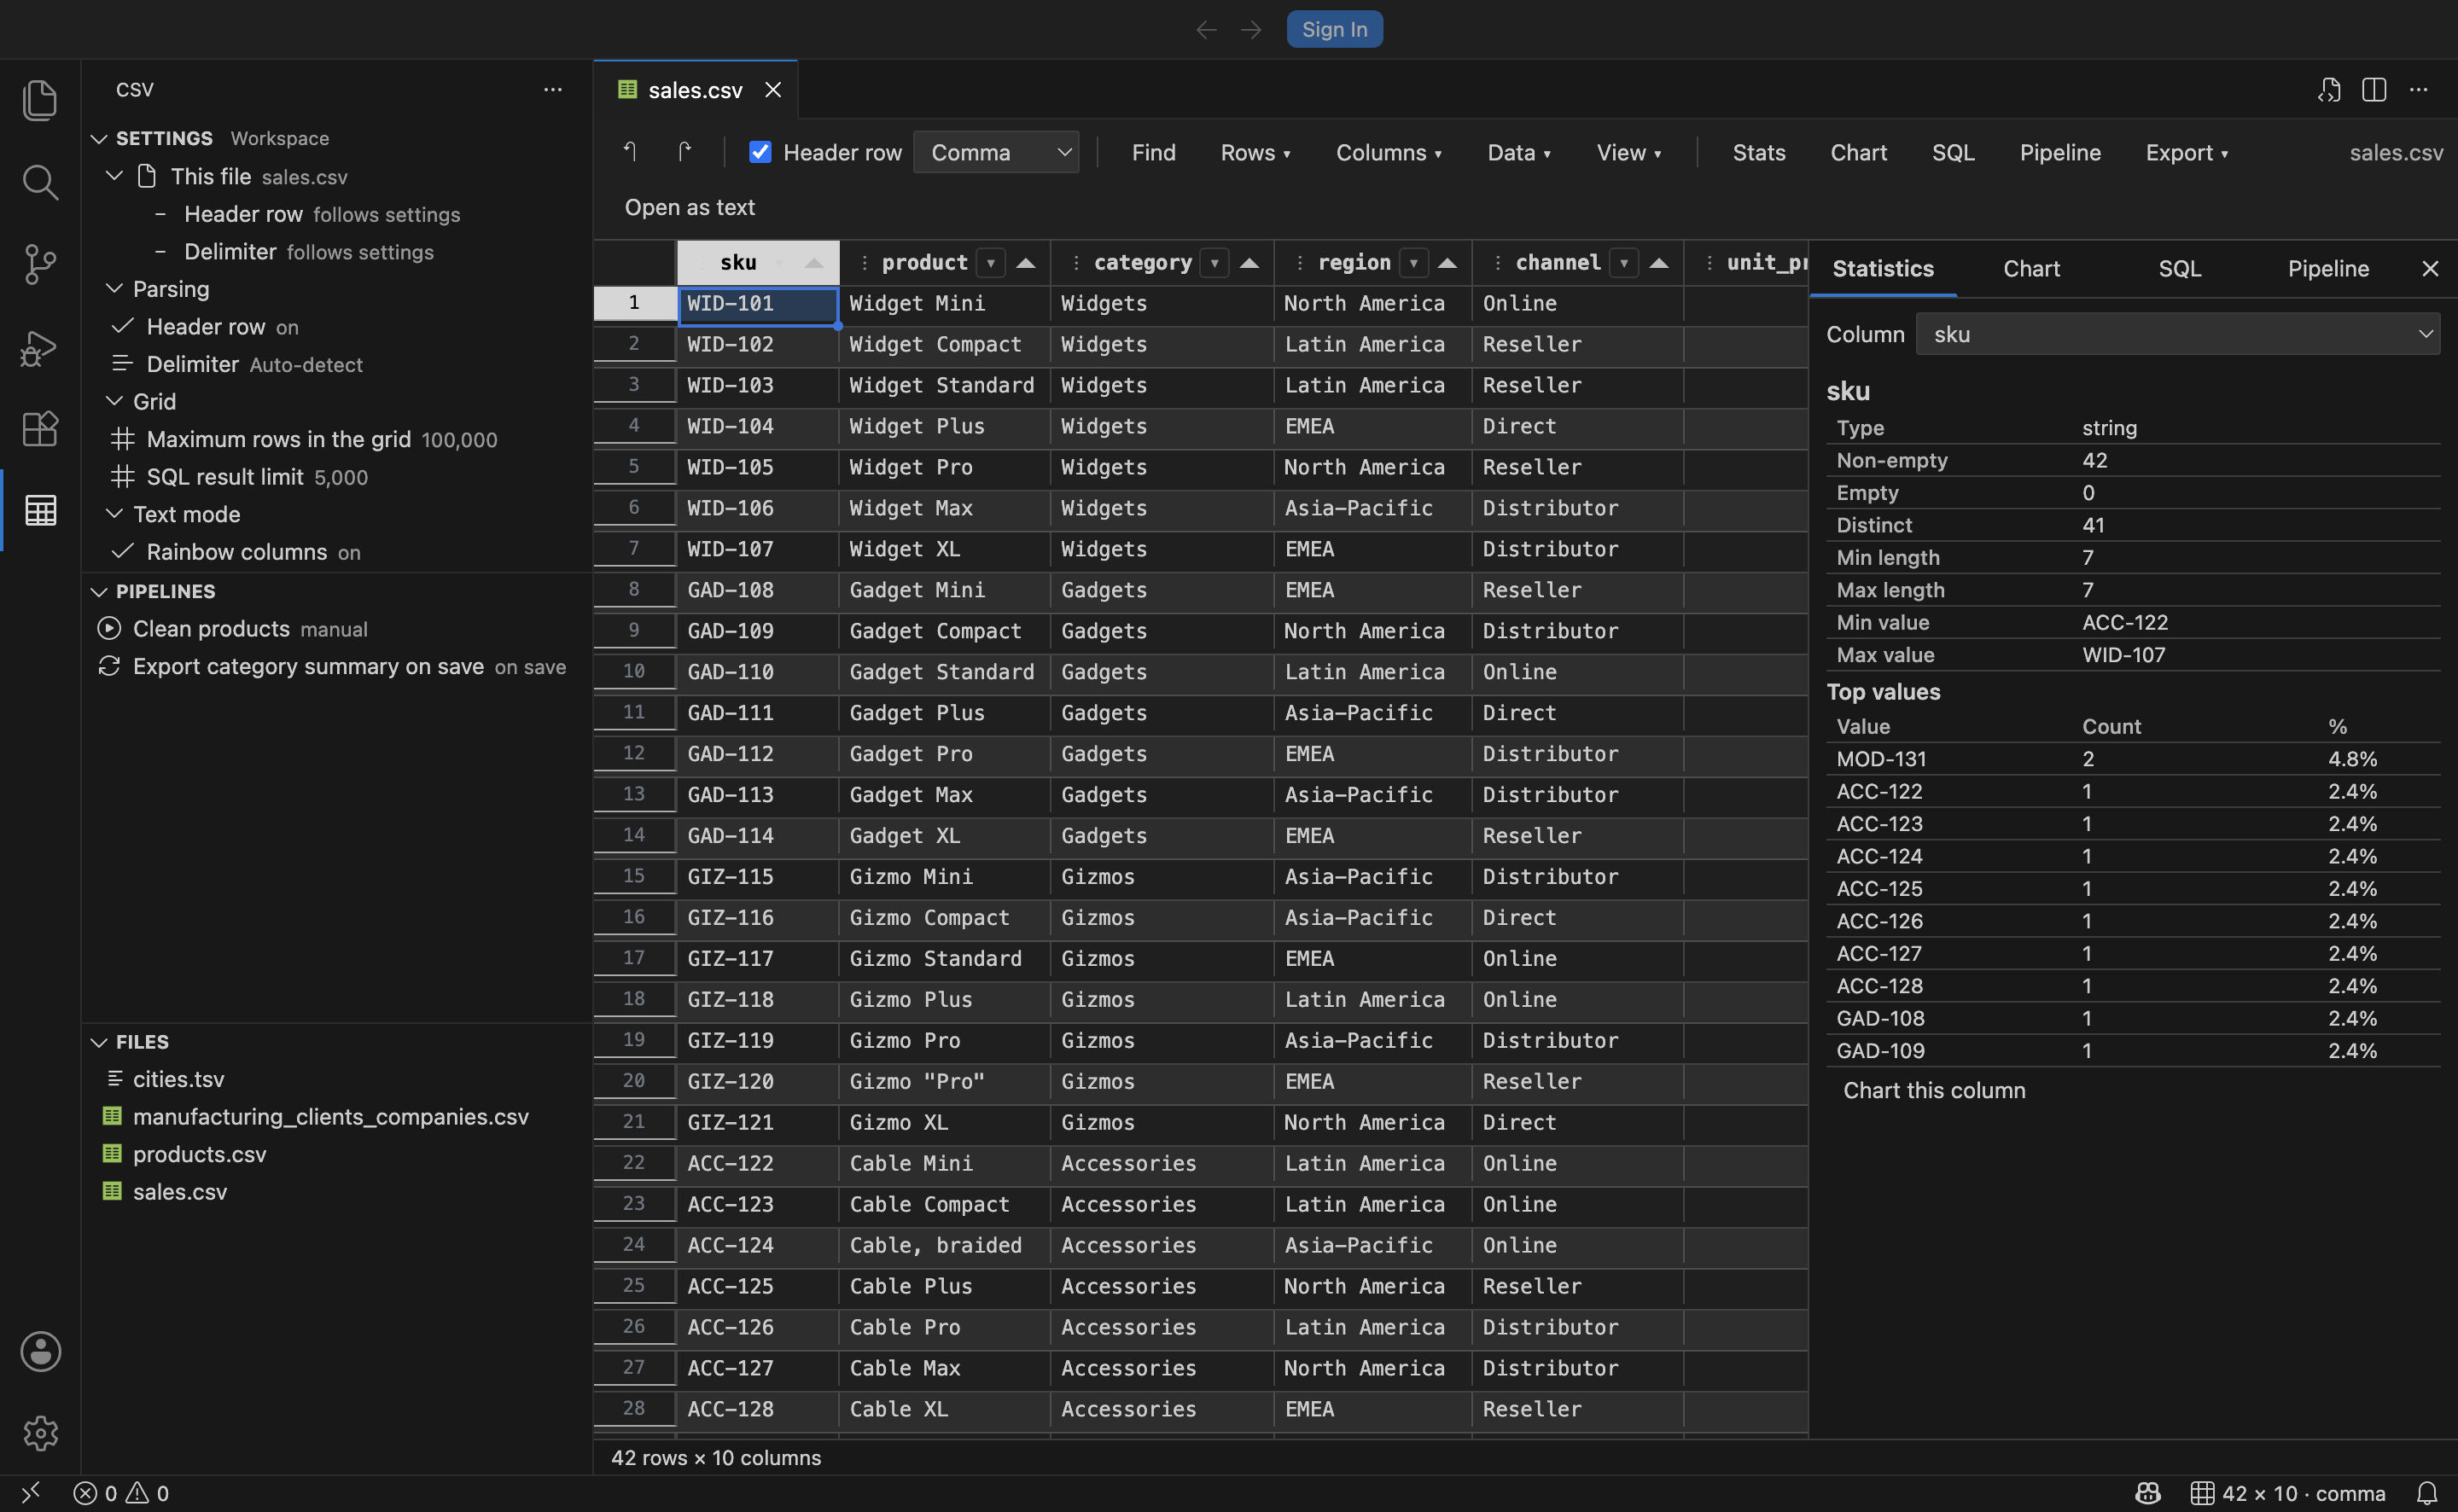
Per column: count, distinct, blanks, minimum, maximum, shortest and longest value, and the most frequent values with their counts. For numeric columns it adds sum, mean, median, standard deviation and quartiles.
This is usually the fastest way to answer what is actually in this file — before you write a single query.
Charts
Section titled “Charts”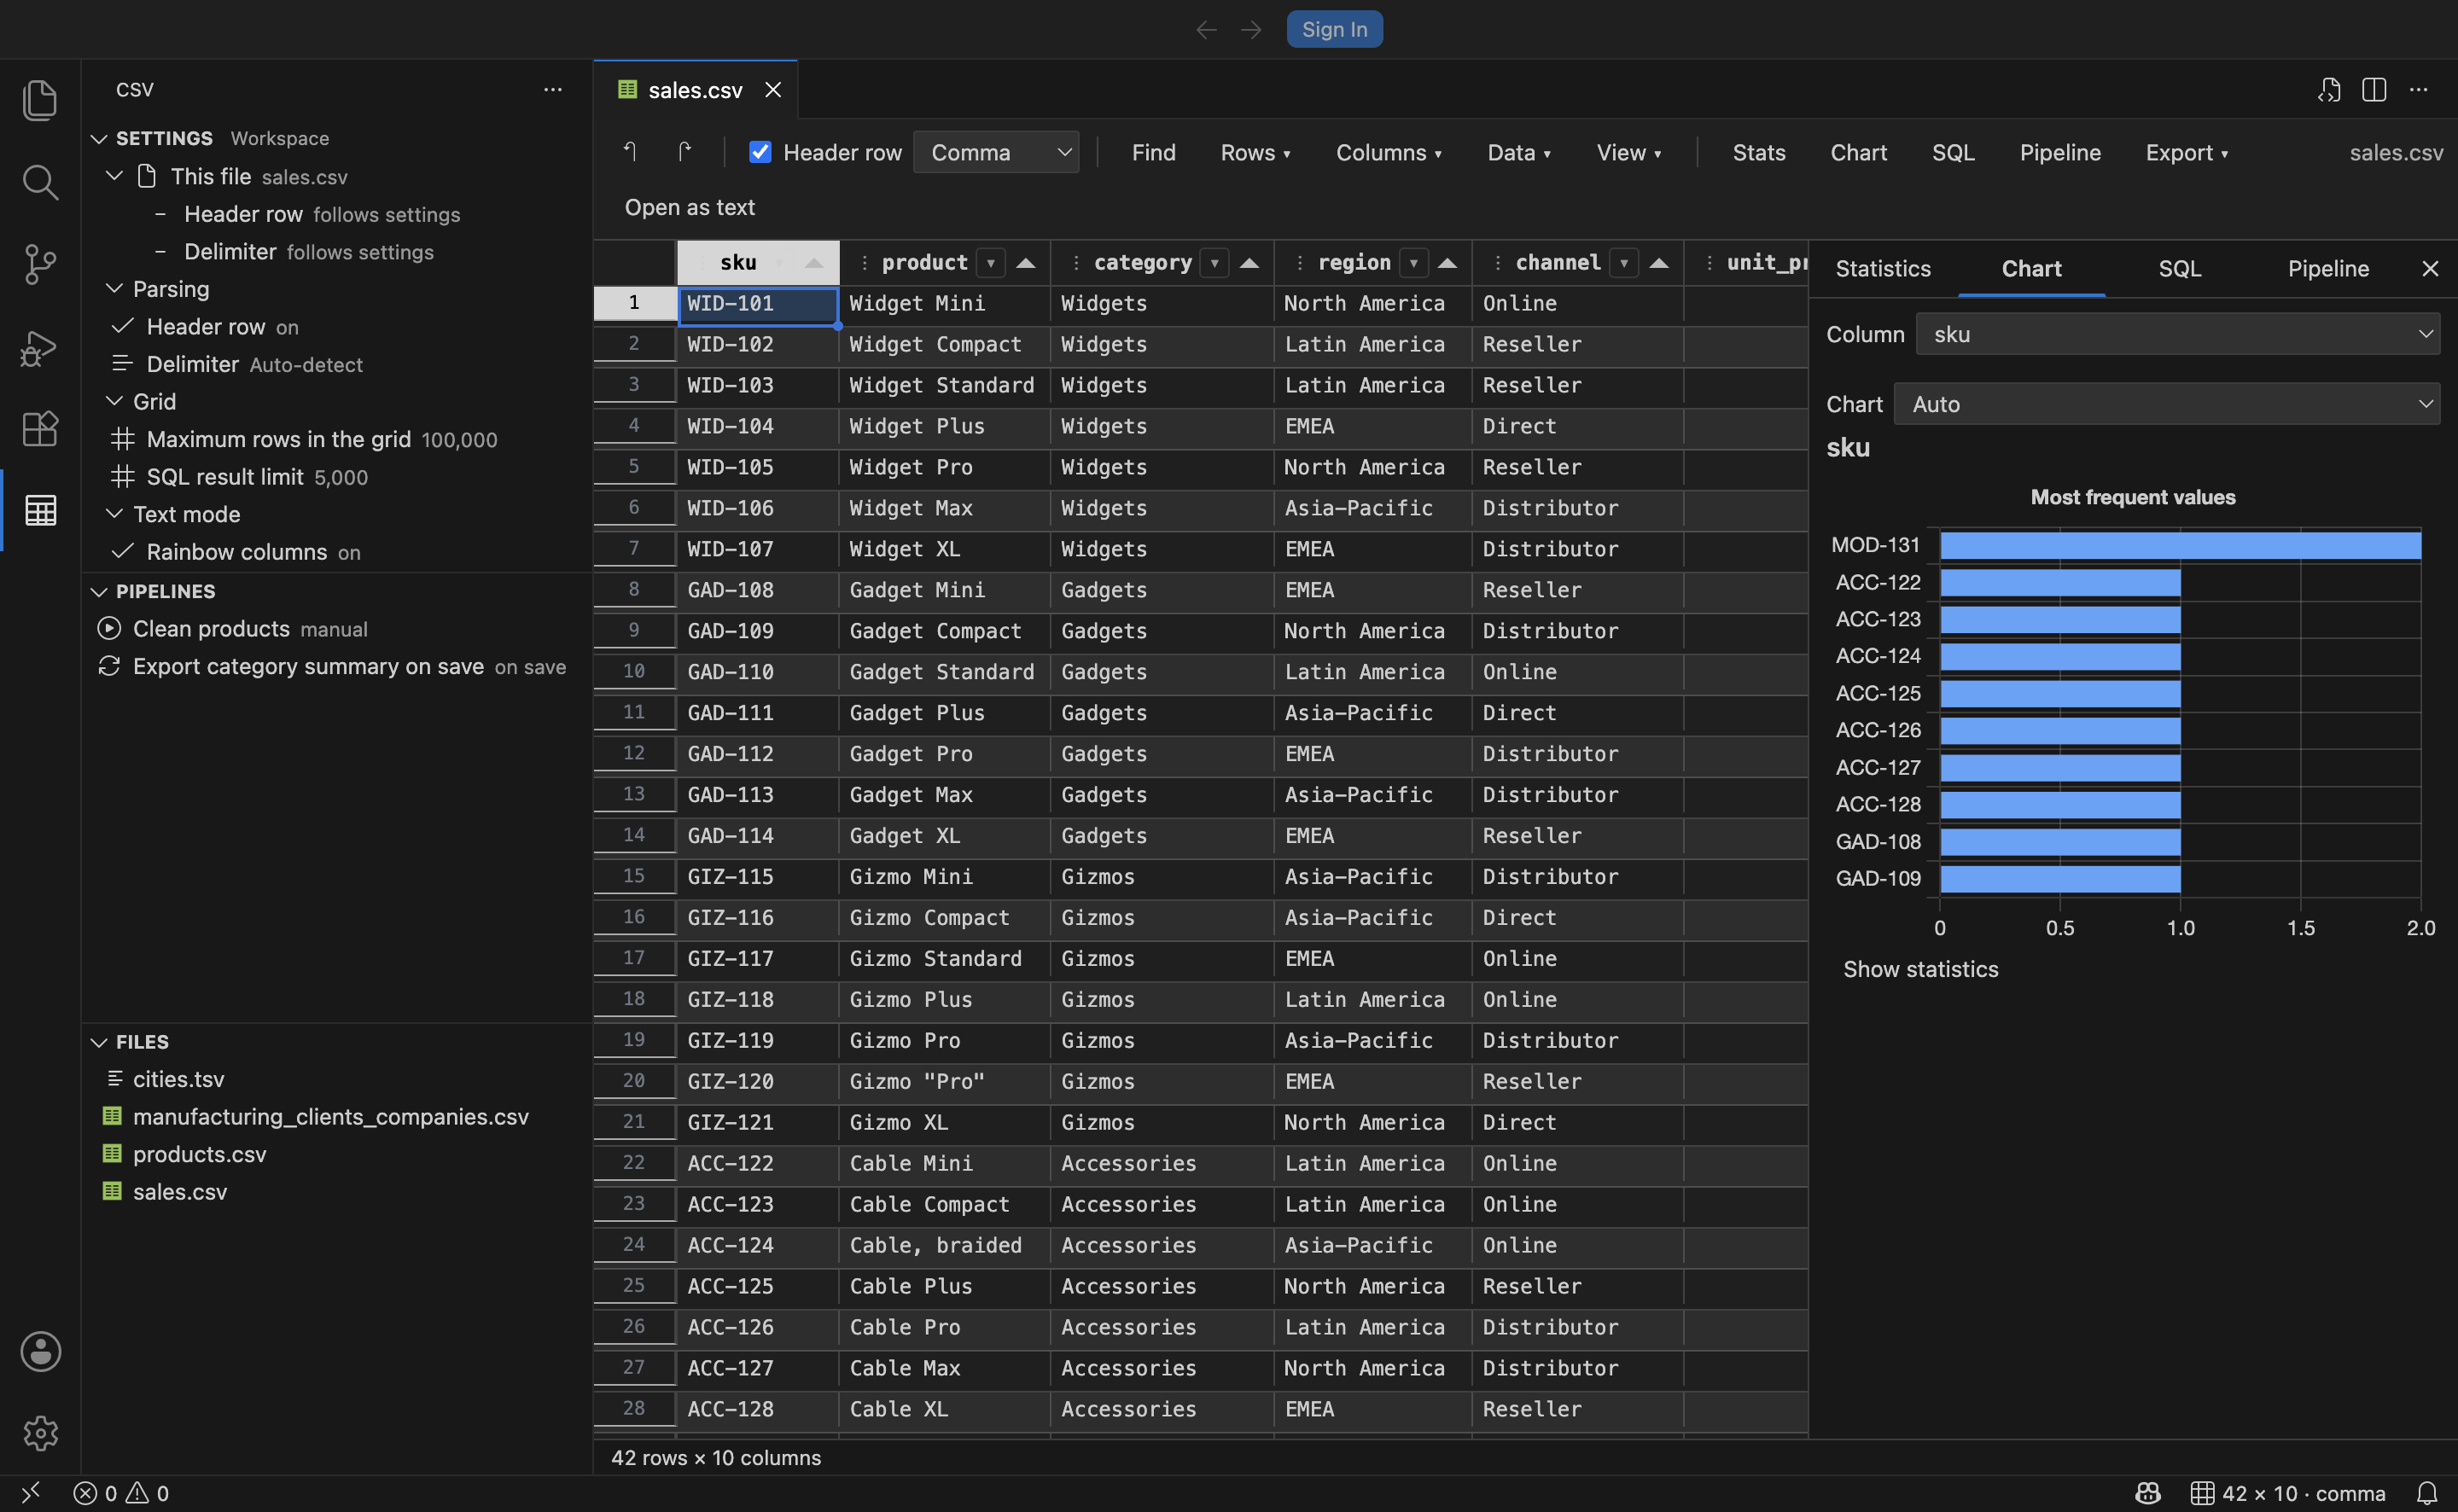
A histogram for numeric columns, a top-values bar chart for everything else. One click from the statistics panel, drawn with Chart.js inside the editor.
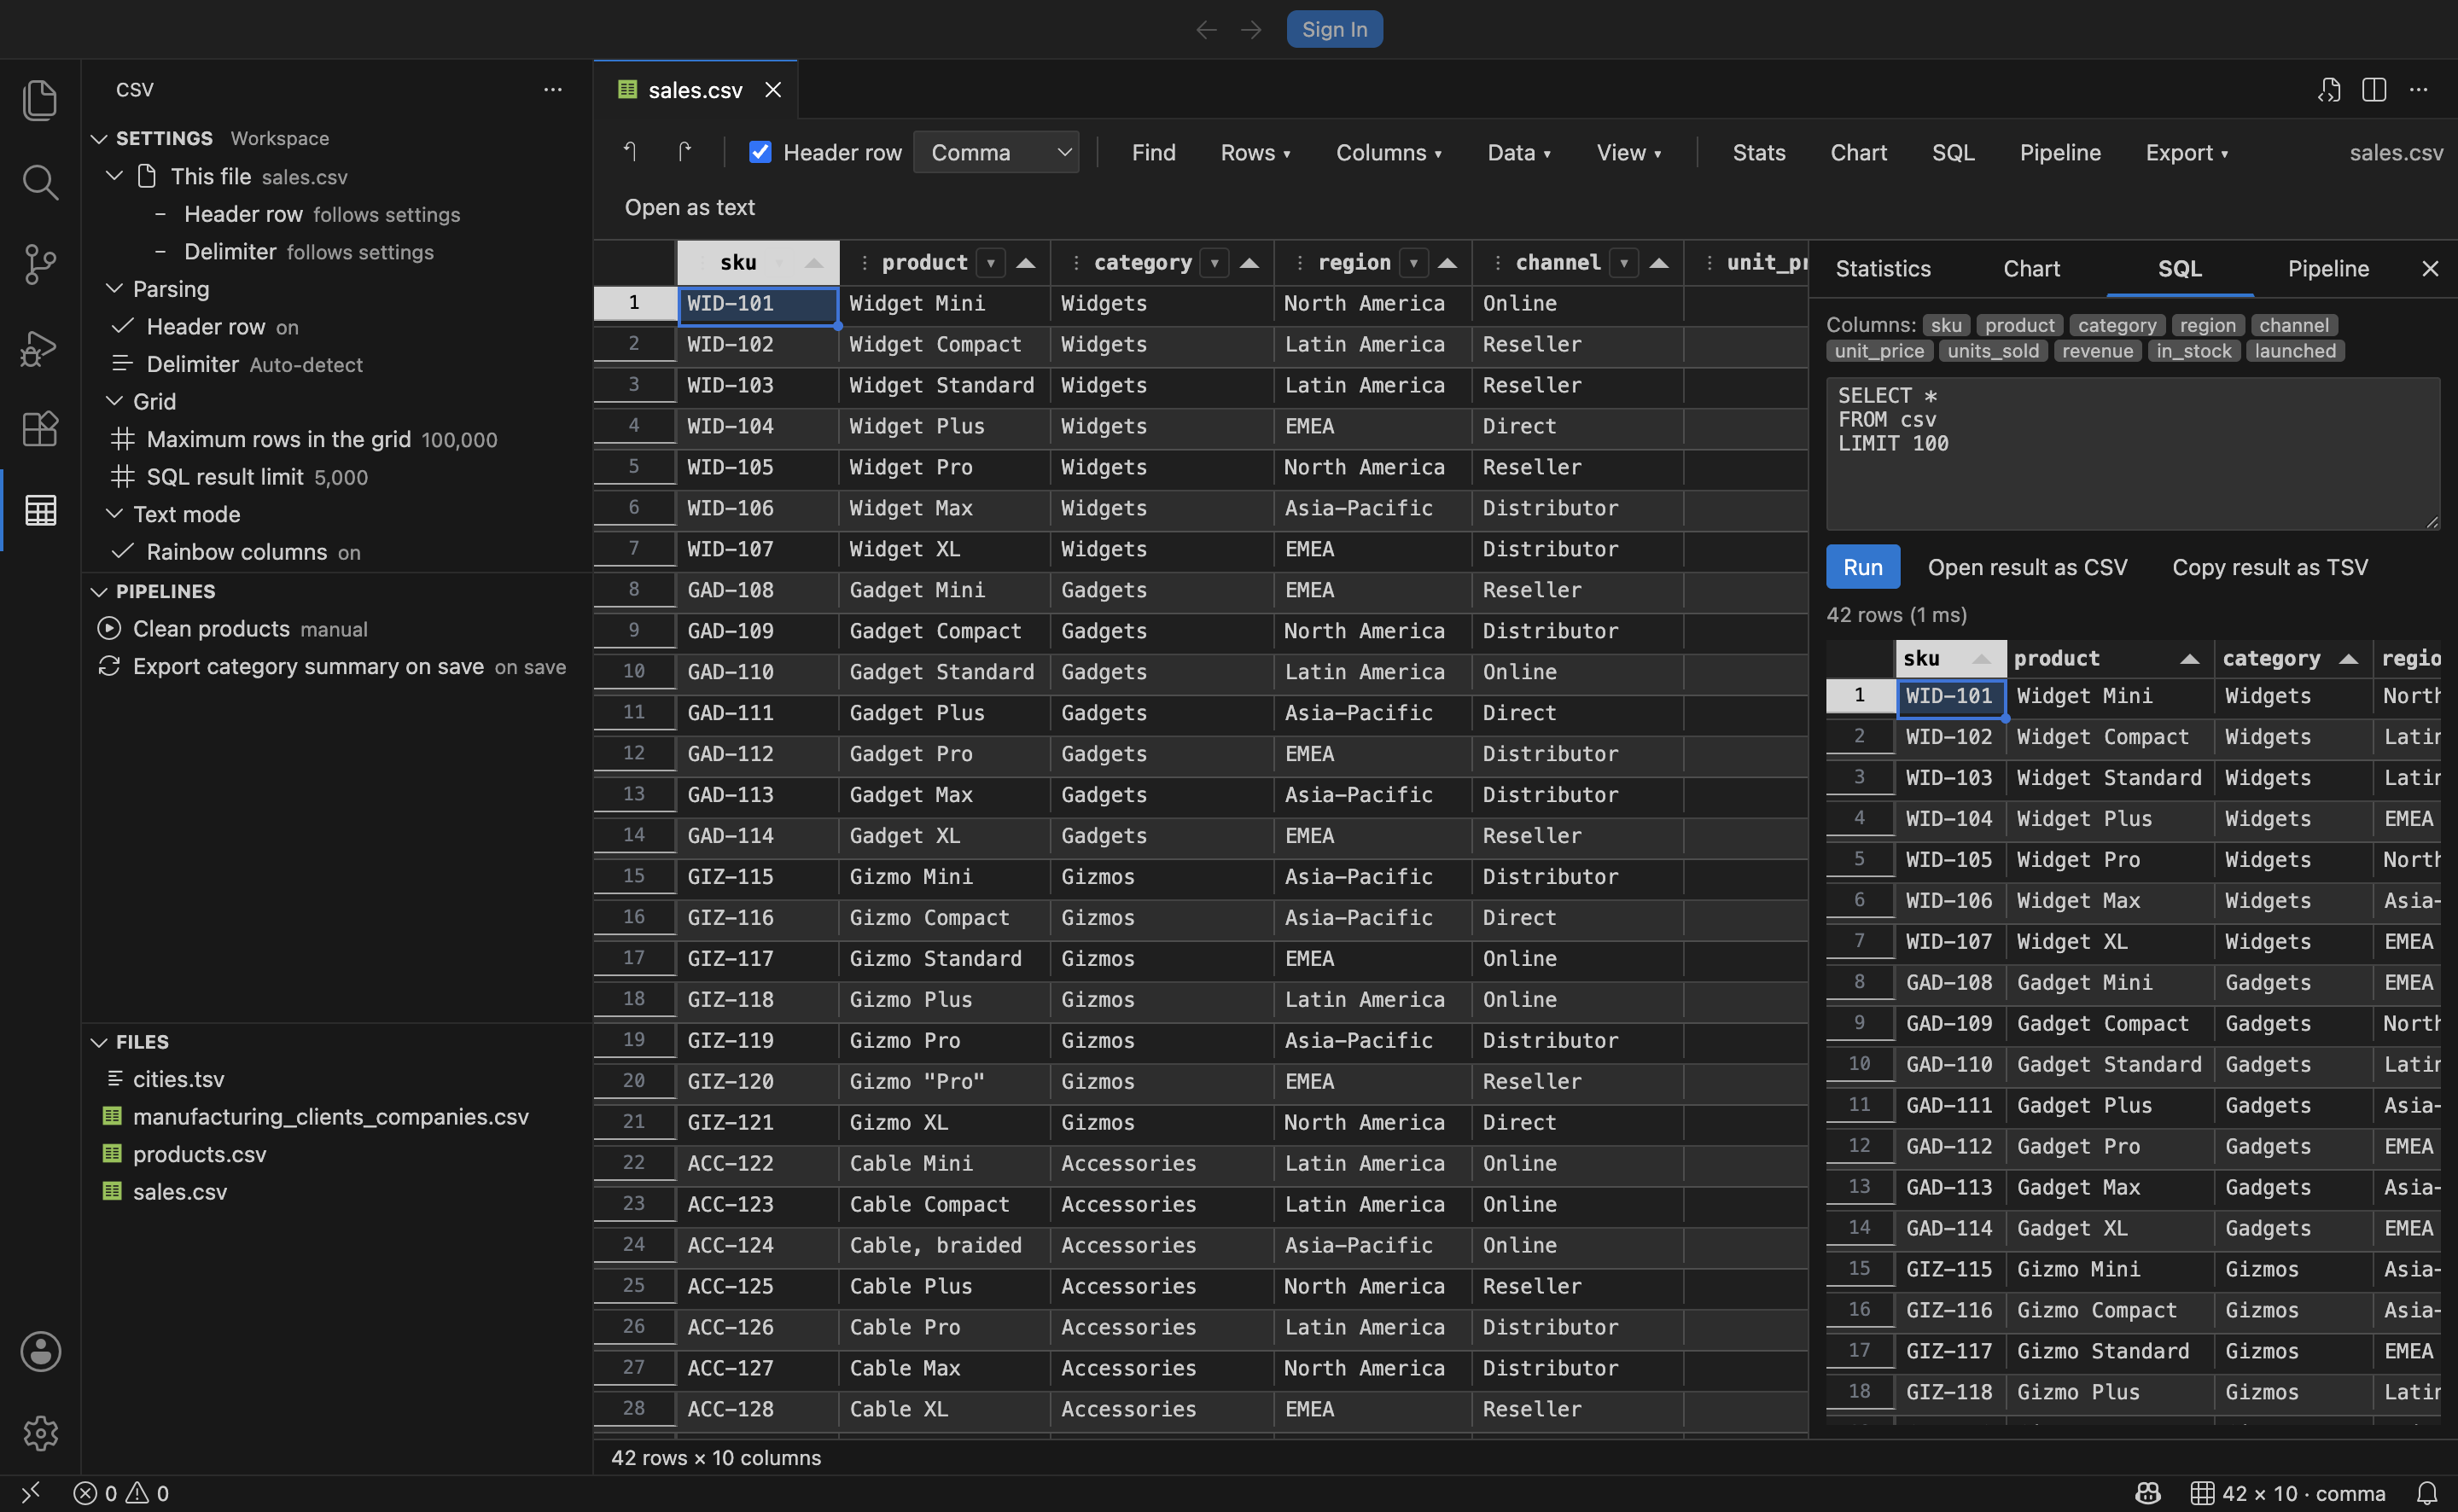
The SQL panel loads the file into an in-memory SQLite database — real SQLite, compiled to WebAssembly — as a table named csv. That means joins onto itself, window functions, CTEs, GROUP BY, the lot:
SELECT category, COUNT(*) AS products, ROUND(AVG(price), 2) AS avg_price, SUM(qty) AS unitsFROM csvWHERE in_stock = 'true'GROUP BY categoryORDER BY units DESC;Results copy to the clipboard or open as a new CSV in their own grid.
Pipelines
Section titled “Pipelines”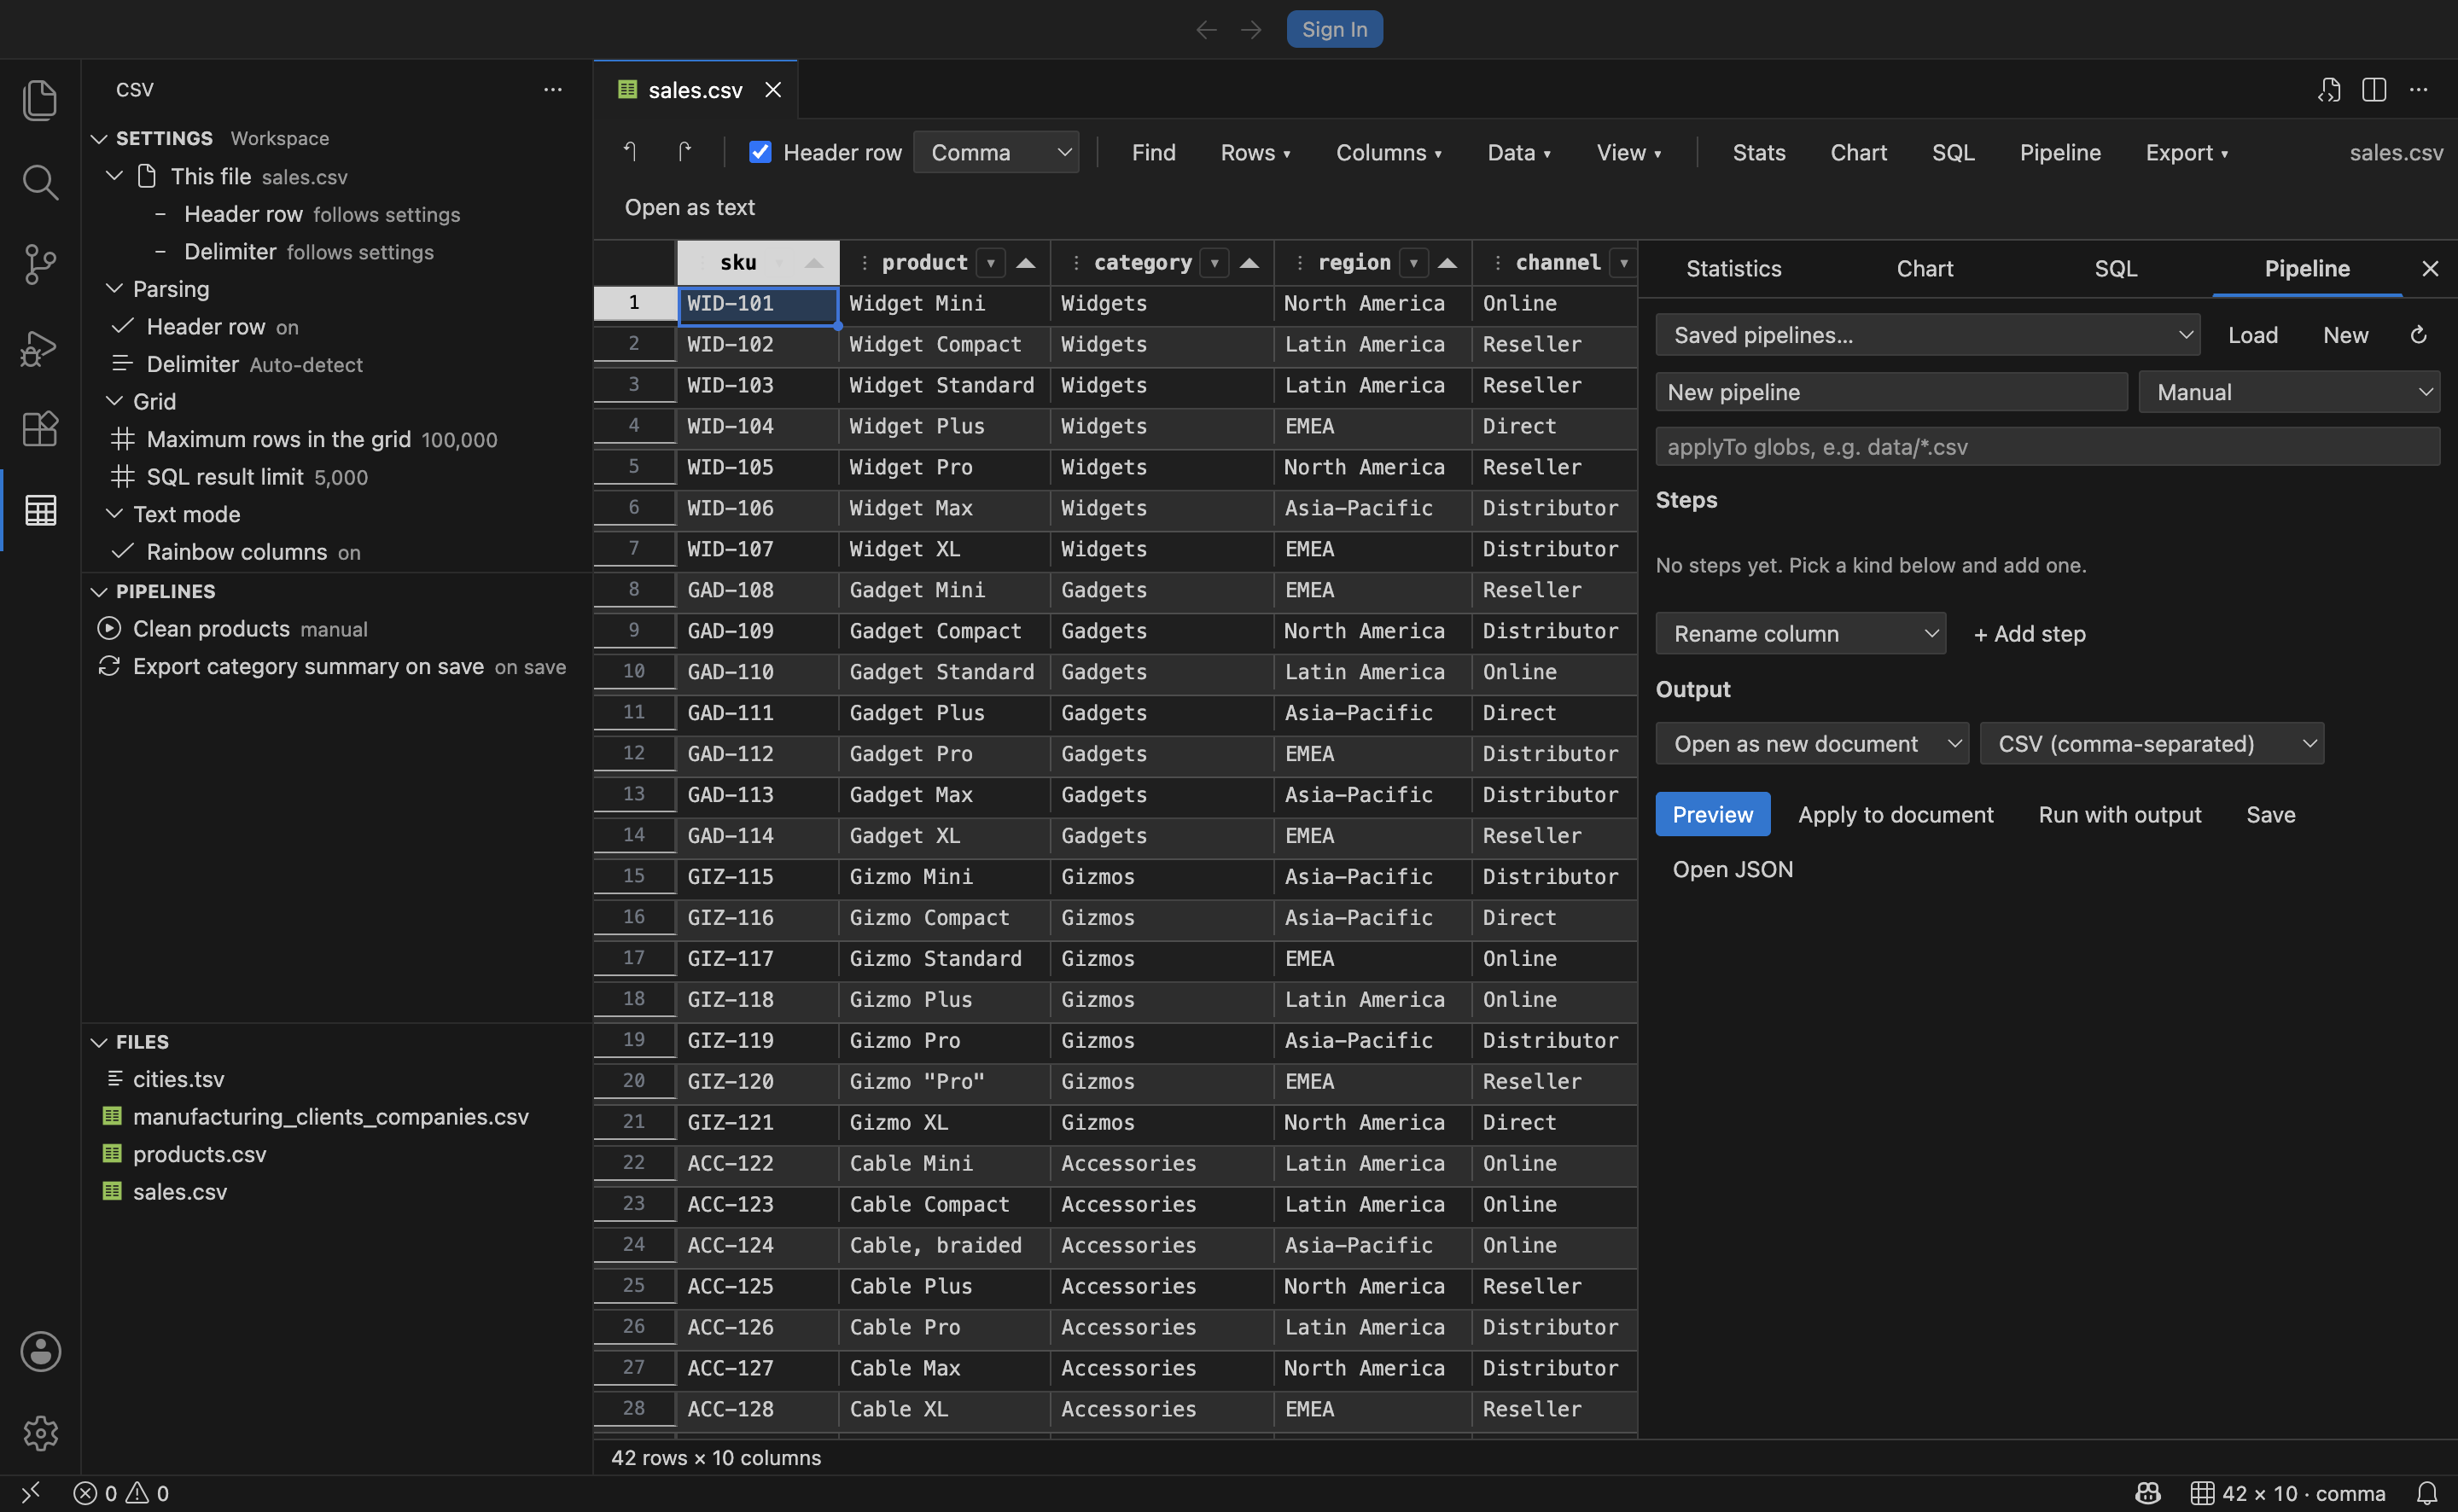
The same cleanup usually happens more than once. Describe it once as a *.csvpipe.json file, then run it on demand, when the file opens, or when it is saved.
| Tier | Steps |
|---|---|
| No-code | trim, change case, fill empty, find and replace, rename, select, drop, sort, dedupe, limit, split column, merge columns, transpose, remove empty rows, random sample |
| Low-code | filter and compute — one-line expressions where columns are variables and 38 helper functions are in scope |
| Code | inline JavaScript, a workspace script file, a SQLite query, or any external command over stdin and stdout |
{ "name": "Clean sales export", "applyTo": ["data/sales-*.csv"], "trigger": "onSave", "output": { "target": "file", "format": "json", "path": "out/${name}-summary.json" }, "steps": [ { "kind": "trim" }, { "kind": "filter", "expression": "in_stock && units_sold > 0" }, { "kind": "compute", "column": "margin", "expression": "round(revenue * 0.18, 2)" }, { "kind": "sql", "query": "SELECT category, SUM(revenue) AS revenue FROM csv GROUP BY category" } ]}Because a command step simply pipes the table through your shell, anything already installed works: pandas, R, jq, awk, csvkit, Miller, qsv.
Export
Section titled “Export”The whole file, or just the selection, to:
- JSON — an array of objects keyed by header
- Markdown — a pipe table you can paste into a README
- HTML — a standalone table
- SQL —
CREATE TABLEplusINSERTstatements - Another delimiter — CSV to TSV, TSV to pipe-delimited, and so on
Selections can go straight to the clipboard in a form Excel and Google Sheets both understand.
The sidebar
Section titled “The sidebar”The CSV icon in the activity bar opens three views.
Every option, in place
Grouped, showing its current value, editable with a toggle for booleans, a picker for choices and a validated prompt for numbers. It also surfaces the per-file header and delimiter overrides, which are otherwise invisible once set from the toolbar. A control in the view title chooses whether edits go to User or Workspace settings.
Everything runnable, ranked
Workspace pipelines with the ones matching the current file first. Run or edit either one in a single click.
Every delimited file
Every .csv, .tsv, .tab and .psv in the workspace, opening straight into the grid or into the text editor.
Text mode
Section titled “Text mode”Not everything wants a grid. Open as text puts you back in the plain editor, where the extension still helps:
- Each column gets its own colour, via semantic highlighting that respects your theme.
- Hovering a cell names its column and position.
- The status bar tracks the column under the cursor.
- Rows whose field count differs from the header are reported in the Problems panel.